29
/es/
es
AIzaSyAYiBZKx7MnpbEhh9jyipgxe19OcubqV5w
April 1, 2024
44818
Low & middle income
LMY
false
2
1
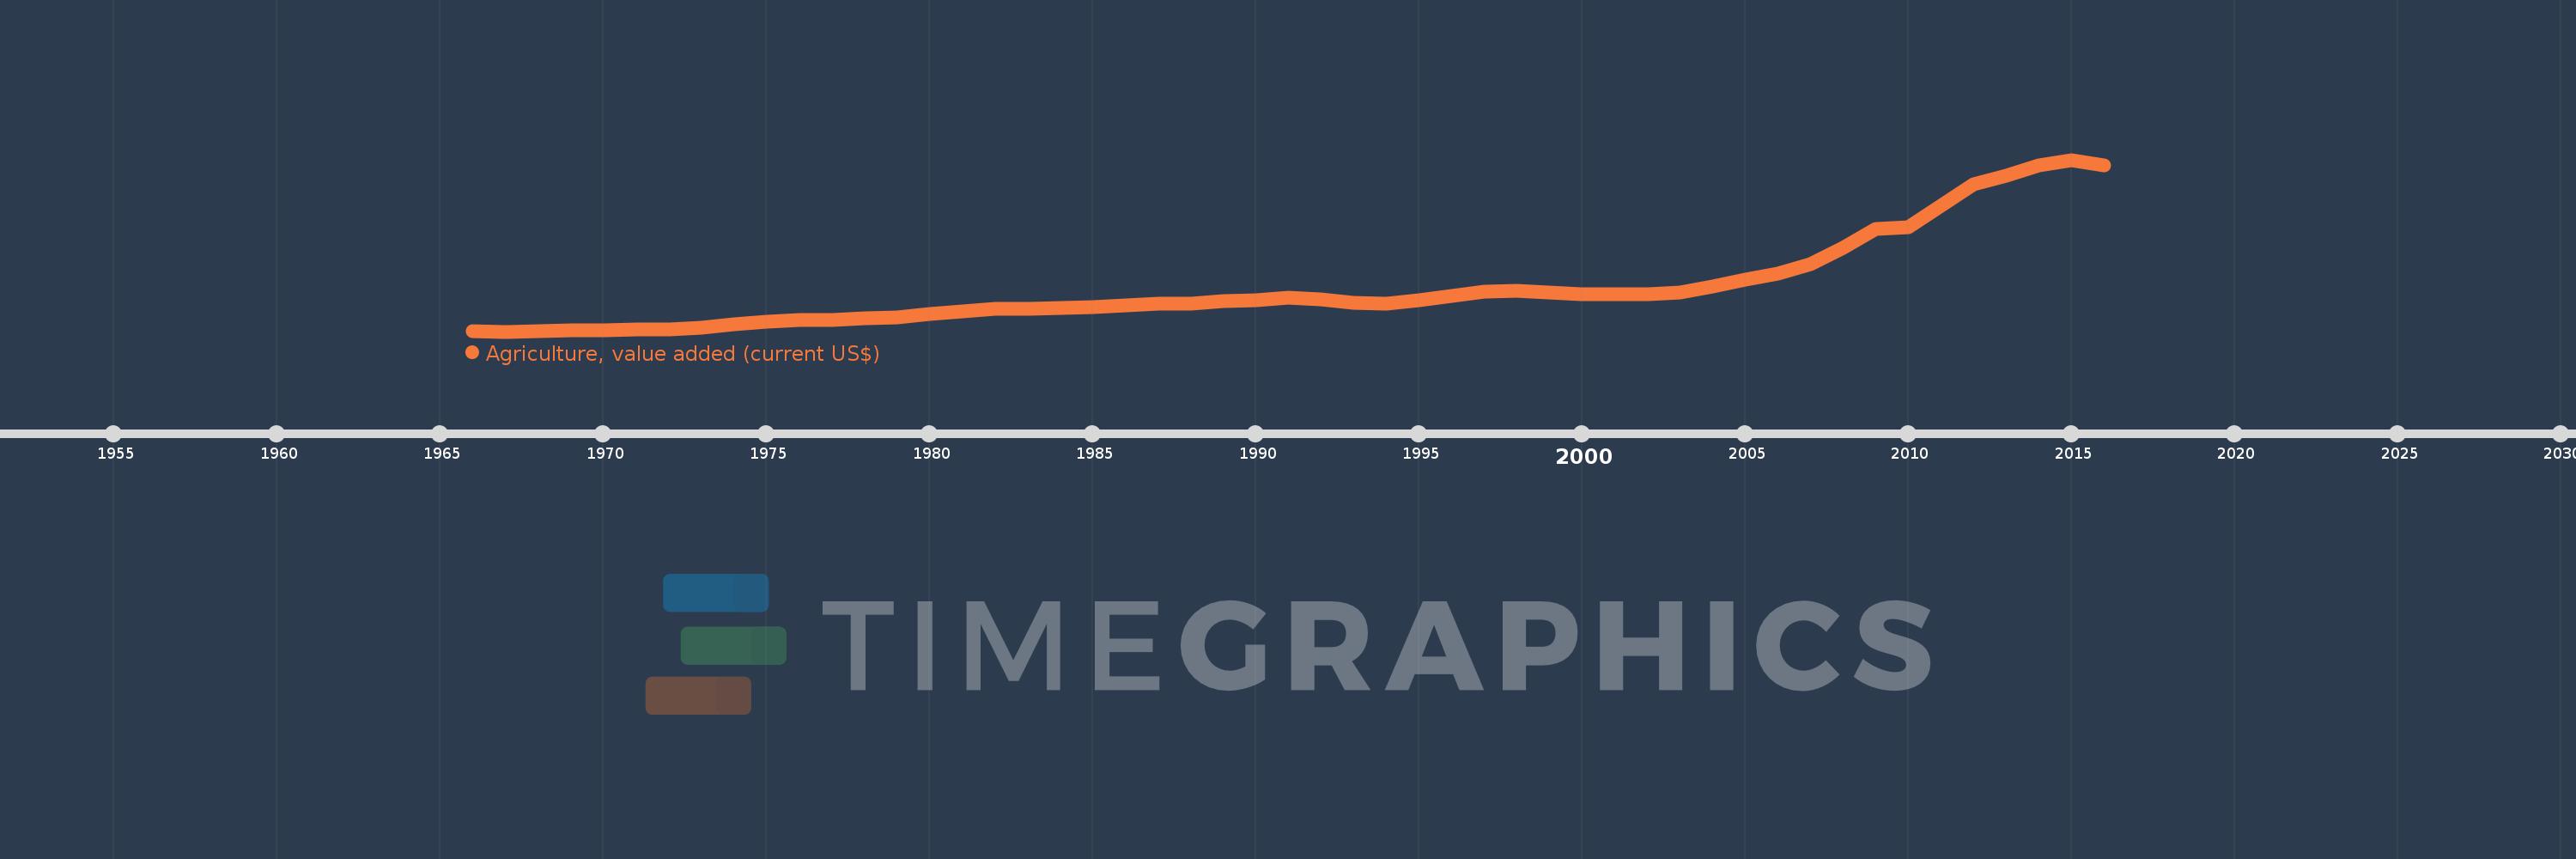
Agriculture, value added (current US$)
2016,2015,2014,2013,2012,2011,2010,2009,2008,2007,2006,2005,2004,2003,2002,2001,2000,1999,1998,1997,1996,1995,1994,1993,1992,1991,1990,1989,1988,1987,1986,1985,1984,1983,1982,1981,1980,1979,1978,1977,1976,1975,1974,1973,1972,1971,1970,1969,1968,1967,1966
Estas estadísticas en otros países:
AfghanistanAlbaniaAlgeriaAndorraAngolaAntigua and BarbudaArab WorldArgentinaArmeniaArubaAustraliaAustriaAzerbaijanBahamas, TheBahrainBangladeshBarbadosBelarusBelgiumBelizeBeninBermudaBhutanBoliviaBosnia and HerzegovinaBotswanaBrazilBrunei DarussalamBulgariaBurkina FasoBurundiCabo VerdeCambodiaCameroonCanadaCaribbean small statesCayman IslandsCentral African RepublicCentral Europe and the BalticsChadChileChinaColombiaComorosCongo, Dem. Rep.Congo, Rep.Costa RicaCote d'IvoireCroatiaCubaCyprusCzech RepublicDenmarkDjiboutiDominicaDominican RepublicEarly-demographic dividendEast Asia & PacificEast Asia & Pacific (excluding high income)East Asia & Pacific (IDA & IBRD countries)EcuadorEgypt, Arab Rep.El SalvadorEquatorial GuineaEritreaEstoniaEthiopiaEuro areaEurope & Central AsiaEurope & Central Asia (excluding high income)Europe & Central Asia (IDA & IBRD countries)European UnionFijiFinlandFragile and conflict affected situationsFranceFrench PolynesiaGabonGambia, TheGeorgiaGermanyGhanaGreeceGrenadaGuatemalaGuineaGuinea-BissauGuyanaHeavily indebted poor countries (HIPC)High incomeHondurasHong Kong SAR, ChinaHungaryIBRD onlyIcelandIDA & IBRD totalIDA blendIDA onlyIDA totalIndiaIndonesiaIran, Islamic Rep.IraqIrelandItalyJamaicaJapanJordanKazakhstanKenyaKiribatiKorea, Rep.KosovoKuwaitKyrgyz RepublicLao PDRLate-demographic dividendLatin America & Caribbean Latin America & Caribbean (excluding high income)Latin America & the Caribbean (IDA & IBRD countries)LatviaLeast developed countries: UN classificationLebanonLesothoLiberiaLibyaLithuaniaLow & middle incomeLow incomeLower middle incomeLuxembourgMacao SAR, ChinaMacedonia, FYRMadagascarMalawiMalaysiaMaldivesMaliMaltaMarshall IslandsMauritaniaMauritiusMexicoMicronesia, Fed. Sts.Middle East & North AfricaMiddle East & North Africa (excluding high income)Middle East & North Africa (IDA & IBRD countries)Middle incomeMoldovaMongoliaMontenegroMoroccoMozambiqueMyanmarNamibiaNepalNetherlandsNew CaledoniaNew ZealandNicaraguaNigerNigeriaNorth AmericaNorwayOECD membersOmanOther small statesPakistanPalauPanamaPapua New GuineaParaguayPeruPhilippinesPolandPortugalPost-demographic dividendPre-demographic dividendPuerto RicoQatarRomaniaRussian FederationRwandaSamoaSao Tome and PrincipeSaudi ArabiaSenegalSerbiaSeychellesSierra LeoneSingaporeSlovak RepublicSloveniaSmall statesSolomon IslandsSouth AfricaSouth AsiaSouth Asia (IDA & IBRD)SpainSri LankaSt. Kitts and NevisSt. LuciaSt. Vincent and the GrenadinesSub-Saharan Africa Sub-Saharan Africa (excluding high income)Sub-Saharan Africa (IDA & IBRD countries)SudanSurinameSwazilandSwedenSwitzerlandSyrian Arab RepublicTajikistanTanzaniaThailandTimor-LesteTogoTongaTrinidad and TobagoTunisiaTurkeyTurkmenistanTuvaluUgandaUkraineUnited Arab EmiratesUnited KingdomUnited StatesUpper middle incomeUruguayUzbekistanVanuatuVenezuela, RBVietnamWest Bank and GazaWorldYemen, Rep.ZambiaZimbabwe línea de tiempo (timeline):
En esta escala de tiempo se presenta un gráfico de 1966 y 2016 de Low & middle income. Los datos de 1965 están ausentes. El número de observaciones reales por fecha: 51.
Fuente (nombre):
Indicadores del desarrollo mundial
Fuente (organización):
World Bank national accounts data, and OECD National Accounts data files.
Categorías:
Agriculture & Rural Development, Economy & Growth
Se ha actualizado:
23 abr 2017 año
Los indicadores de los cambios de valor en los últimos años
Mínimo:
133.948 bn
1 ene 1967 año
Máximo:
2.626 billones
1 ene 2015 año
A la fecha de observación
Valor
Cambio absoluto
El cambio con respecto al valor anterior
1 ene 1966 año
134.414 bn
+134.414 bn
0.0%
1 ene 1967 año
133.948 bn
-466.085 millones
-0.35%
1 ene 1968 año
143.246 bn
+9.298 bn
6.94%
1 ene 1969 año
148.535 bn
+5.289 bn
3.69%
1 ene 1970 año
158.331 bn
+9.795 bn
6.59%
1 ene 1971 año
165.1 bn
+6.77 bn
4.28%
1 ene 1972 año
170.504 bn
+5.404 bn
3.27%
1 ene 1973 año
185.701 bn
+15.197 bn
8.91%
1 ene 1974 año
233.888 bn
+48.187 bn
25.95%
1 ene 1975 año
276.2 bn
+42.313 bn
18.09%
1 ene 1976 año
297.102 bn
+20.902 bn
7.57%
1 ene 1977 año
296.11 bn
-992.159 millones
-0.33%
1 ene 1978 año
331.674 bn
+35.564 bn
12.01%
1 ene 1979 año
342.017 bn
+10.343 bn
3.12%
1 ene 1980 año
395.101 bn
+53.084 bn
15.52%
1 ene 1981 año
432.91 bn
+37.809 bn
9.57%
1 ene 1982 año
463.763 bn
+30.854 bn
7.13%
1 ene 1983 año
465.215 bn
+1.452 bn
0.31%
1 ene 1984 año
479.058 bn
+13.842 bn
2.98%
1 ene 1985 año
491.345 bn
+12.287 bn
2.56%
1 ene 1986 año
514.165 bn
+22.82 bn
4.64%
1 ene 1987 año
535.462 bn
+21.297 bn
4.14%
1 ene 1988 año
542.488 bn
+7.026 bn
1.31%
1 ene 1989 año
577.66 bn
+35.172 bn
6.48%
1 ene 1990 año
583.226 bn
+5.567 bn
0.96%
1 ene 1991 año
622.763 bn
+39.536 bn
6.78%
1 ene 1992 año
607.206 bn
-15.557 bn
-2.5%
1 ene 1993 año
555.749 bn
-51.457 bn
-8.47%
1 ene 1994 año
543.174 bn
-12.576 bn
-2.26%
1 ene 1995 año
593.443 bn
+50.269 bn
9.25%
1 ene 1996 año
655.503 bn
+62.06 bn
10.46%
1 ene 1997 año
718.922 bn
+63.419 bn
9.67%
1 ene 1998 año
723.349 bn
+4.427 bn
0.62%
1 ene 1999 año
699.306 bn
-24.043 bn
-3.32%
1 ene 2000 año
676.649 bn
-22.657 bn
-3.24%
1 ene 2001 año
673.373 bn
-3.276 bn
-0.48%
1 ene 2002 año
674.3 bn
+927.054 millones
0.14%
1 ene 2003 año
705.973 bn
+31.672 bn
4.7%
1 ene 2004 año
786.083 bn
+80.111 bn
11.35%
1 ene 2005 año
891.167 bn
+105.084 bn
13.37%
1 ene 2006 año
980.208 bn
+89.041 bn
9.99%
1 ene 2007 año
1.106 billones
+126.165 bn
12.87%
1 ene 2008 año
1.355 billones
+248.469 bn
22.46%
1 ene 2009 año
1.623 billones
+268.328 bn
19.81%
1 ene 2010 año
1.649 billones
+26.225 bn
1.62%
1 ene 2011 año
1.953 billones
+303.564 bn
18.4%
1 ene 2012 año
2.271 billones
+318.39 bn
16.3%
1 ene 2013 año
2.392 billones
+120.8 bn
5.32%
1 ene 2014 año
2.545 billones
+152.498 bn
6.37%
1 ene 2015 año
2.626 billones
+81.09 bn
3.19%
1 ene 2016 año
2.544 billones
-81.994 bn
-3.12%
Ranking de los países por los datos estadísticos actuales


Comentarios: