29
/es/
es
AIzaSyAYiBZKx7MnpbEhh9jyipgxe19OcubqV5w
April 1, 2024
36360
IBRD only
IBD
false
2
1
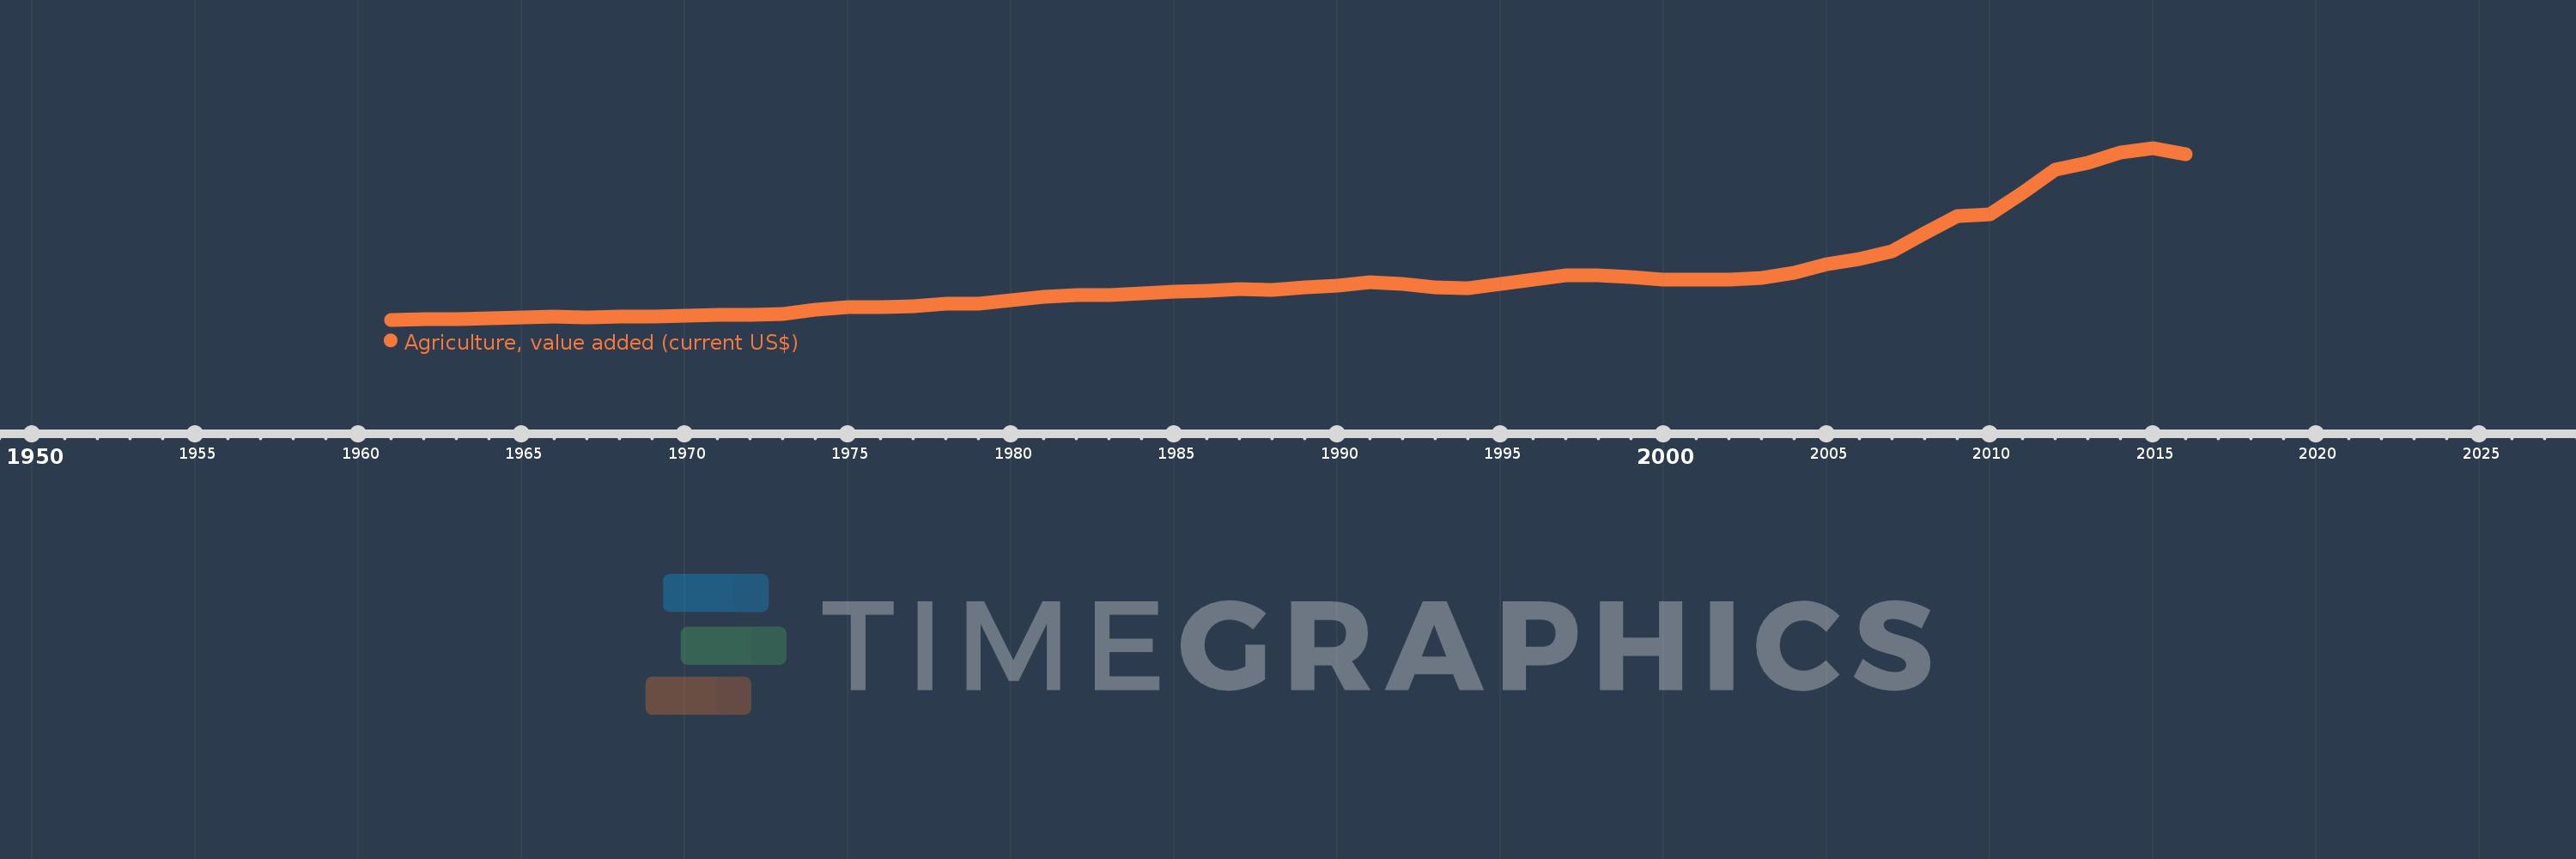
Agriculture, value added (current US$)
2016,2015,2014,2013,2012,2011,2010,2009,2008,2007,2006,2005,2004,2003,2002,2001,2000,1999,1998,1997,1996,1995,1994,1993,1992,1991,1990,1989,1988,1987,1986,1985,1984,1983,1982,1981,1980,1979,1978,1977,1976,1975,1974,1973,1972,1971,1970,1969,1968,1967,1966,1965,1964,1963,1962,1961
Estas estadísticas en otros países:
AfghanistanAlbaniaAlgeriaAndorraAngolaAntigua and BarbudaArab WorldArgentinaArmeniaArubaAustraliaAustriaAzerbaijanBahamas, TheBahrainBangladeshBarbadosBelarusBelgiumBelizeBeninBermudaBhutanBoliviaBosnia and HerzegovinaBotswanaBrazilBrunei DarussalamBulgariaBurkina FasoBurundiCabo VerdeCambodiaCameroonCanadaCaribbean small statesCayman IslandsCentral African RepublicCentral Europe and the BalticsChadChileChinaColombiaComorosCongo, Dem. Rep.Congo, Rep.Costa RicaCote d'IvoireCroatiaCubaCyprusCzech RepublicDenmarkDjiboutiDominicaDominican RepublicEarly-demographic dividendEast Asia & PacificEast Asia & Pacific (excluding high income)East Asia & Pacific (IDA & IBRD countries)EcuadorEgypt, Arab Rep.El SalvadorEquatorial GuineaEritreaEstoniaEthiopiaEuro areaEurope & Central AsiaEurope & Central Asia (excluding high income)Europe & Central Asia (IDA & IBRD countries)European UnionFijiFinlandFragile and conflict affected situationsFranceFrench PolynesiaGabonGambia, TheGeorgiaGermanyGhanaGreeceGrenadaGuatemalaGuineaGuinea-BissauGuyanaHeavily indebted poor countries (HIPC)High incomeHondurasHong Kong SAR, ChinaHungaryIBRD onlyIcelandIDA & IBRD totalIDA blendIDA onlyIDA totalIndiaIndonesiaIran, Islamic Rep.IraqIrelandItalyJamaicaJapanJordanKazakhstanKenyaKiribatiKorea, Rep.KosovoKuwaitKyrgyz RepublicLao PDRLate-demographic dividendLatin America & Caribbean Latin America & Caribbean (excluding high income)Latin America & the Caribbean (IDA & IBRD countries)LatviaLeast developed countries: UN classificationLebanonLesothoLiberiaLibyaLithuaniaLow & middle incomeLow incomeLower middle incomeLuxembourgMacao SAR, ChinaMacedonia, FYRMadagascarMalawiMalaysiaMaldivesMaliMaltaMarshall IslandsMauritaniaMauritiusMexicoMicronesia, Fed. Sts.Middle East & North AfricaMiddle East & North Africa (excluding high income)Middle East & North Africa (IDA & IBRD countries)Middle incomeMoldovaMongoliaMontenegroMoroccoMozambiqueMyanmarNamibiaNepalNetherlandsNew CaledoniaNew ZealandNicaraguaNigerNigeriaNorth AmericaNorwayOECD membersOmanOther small statesPakistanPalauPanamaPapua New GuineaParaguayPeruPhilippinesPolandPortugalPost-demographic dividendPre-demographic dividendPuerto RicoQatarRomaniaRussian FederationRwandaSamoaSao Tome and PrincipeSaudi ArabiaSenegalSerbiaSeychellesSierra LeoneSingaporeSlovak RepublicSloveniaSmall statesSolomon IslandsSouth AfricaSouth AsiaSouth Asia (IDA & IBRD)SpainSri LankaSt. Kitts and NevisSt. LuciaSt. Vincent and the GrenadinesSub-Saharan Africa Sub-Saharan Africa (excluding high income)Sub-Saharan Africa (IDA & IBRD countries)SudanSurinameSwazilandSwedenSwitzerlandSyrian Arab RepublicTajikistanTanzaniaThailandTimor-LesteTogoTongaTrinidad and TobagoTunisiaTurkeyTurkmenistanTuvaluUgandaUkraineUnited Arab EmiratesUnited KingdomUnited StatesUpper middle incomeUruguayUzbekistanVanuatuVenezuela, RBVietnamWest Bank and GazaWorldYemen, Rep.ZambiaZimbabwe línea de tiempo (timeline):
En esta escala de tiempo se presenta un gráfico de 1961 y 2016 de IBRD only. Los datos de 1960 están ausentes. El número de observaciones reales por fecha: 56.
Fuente (nombre):
Indicadores del desarrollo mundial
Fuente (organización):
World Bank national accounts data, and OECD National Accounts data files.
Categorías:
Agriculture & Rural Development, Economy & Growth
Se ha actualizado:
23 abr 2017 año
Los indicadores de los cambios de valor en los últimos años
Mínimo:
74.777 bn
1 ene 1961 año
Máximo:
2.145 billones
1 ene 2015 año
A la fecha de observación
Valor
Cambio absoluto
El cambio con respecto al valor anterior
1 ene 1961 año
74.777 bn
+74.777 bn
0.0%
1 ene 1962 año
77.321 bn
+2.544 bn
3.4%
1 ene 1963 año
78.544 bn
+1.223 bn
1.58%
1 ene 1964 año
88.407 bn
+9.863 bn
12.56%
1 ene 1965 año
100.08 bn
+11.674 bn
13.2%
1 ene 1966 año
108.005 bn
+7.925 bn
7.92%
1 ene 1967 año
106.686 bn
-1.319 bn
-1.22%
1 ene 1968 año
113.899 bn
+7.213 bn
6.76%
1 ene 1969 año
118.182 bn
+4.283 bn
3.76%
1 ene 1970 año
125.563 bn
+7.381 bn
6.25%
1 ene 1971 año
130.128 bn
+4.564 bn
3.64%
1 ene 1972 año
135.016 bn
+4.888 bn
3.76%
1 ene 1973 año
149.101 bn
+14.085 bn
10.43%
1 ene 1974 año
191.528 bn
+42.426 bn
28.45%
1 ene 1975 año
221.795 bn
+30.268 bn
15.8%
1 ene 1976 año
229.719 bn
+7.924 bn
3.57%
1 ene 1977 año
236.716 bn
+6.997 bn
3.05%
1 ene 1978 año
265.425 bn
+28.71 bn
12.13%
1 ene 1979 año
268.378 bn
+2.953 bn
1.11%
1 ene 1980 año
311.998 bn
+43.62 bn
16.25%
1 ene 1981 año
349.652 bn
+37.654 bn
12.07%
1 ene 1982 año
374.276 bn
+24.624 bn
7.04%
1 ene 1983 año
376.077 bn
+1.801 bn
0.48%
1 ene 1984 año
397.158 bn
+21.081 bn
5.61%
1 ene 1985 año
409.203 bn
+12.045 bn
3.03%
1 ene 1986 año
426.157 bn
+16.954 bn
4.14%
1 ene 1987 año
439.098 bn
+12.94 bn
3.04%
1 ene 1988 año
434.38 bn
-4.718 bn
-1.07%
1 ene 1989 año
467.999 bn
+33.62 bn
7.74%
1 ene 1990 año
488.985 bn
+20.985 bn
4.48%
1 ene 1991 año
523.826 bn
+34.841 bn
7.13%
1 ene 1992 año
505.038 bn
-18.788 bn
-3.59%
1 ene 1993 año
460.38 bn
-44.659 bn
-8.84%
1 ene 1994 año
454.683 bn
-5.696 bn
-1.24%
1 ene 1995 año
507.017 bn
+52.334 bn
11.51%
1 ene 1996 año
557.1 bn
+50.083 bn
9.88%
1 ene 1997 año
611.495 bn
+54.395 bn
9.76%
1 ene 1998 año
608.319 bn
-3.176 bn
-0.52%
1 ene 1999 año
584.938 bn
-23.381 bn
-3.84%
1 ene 2000 año
562.317 bn
-22.62 bn
-3.87%
1 ene 2001 año
555.169 bn
-7.148 bn
-1.27%
1 ene 2002 año
559.005 bn
+3.836 bn
0.69%
1 ene 2003 año
575.771 bn
+16.766 bn
3.0%
1 ene 2004 año
643.46 bn
+67.689 bn
11.76%
1 ene 2005 año
741.656 bn
+98.196 bn
15.26%
1 ene 2006 año
807.544 bn
+65.888 bn
8.88%
1 ene 2007 año
899.955 bn
+92.411 bn
11.44%
1 ene 2008 año
1.117 billones
+216.603 bn
24.07%
1 ene 2009 año
1.325 billones
+208.785 bn
18.7%
1 ene 2010 año
1.346 billones
+20.585 bn
1.55%
1 ene 2011 año
1.602 billones
+256.102 bn
19.03%
1 ene 2012 año
1.878 billones
+276.032 bn
17.23%
1 ene 2013 año
1.961 billones
+82.992 bn
4.42%
1 ene 2014 año
2.092 billones
+130.995 bn
6.68%
1 ene 2015 año
2.145 billones
+52.503 bn
2.51%
1 ene 2016 año
2.066 billones
-78.59 bn
-3.66%
Ranking de los países por los datos estadísticos actuales


Comentarios: