29
/es/
es
AIzaSyAYiBZKx7MnpbEhh9jyipgxe19OcubqV5w
April 1, 2024
44652
Least developed countries: UN classification
LDC
false
2
1
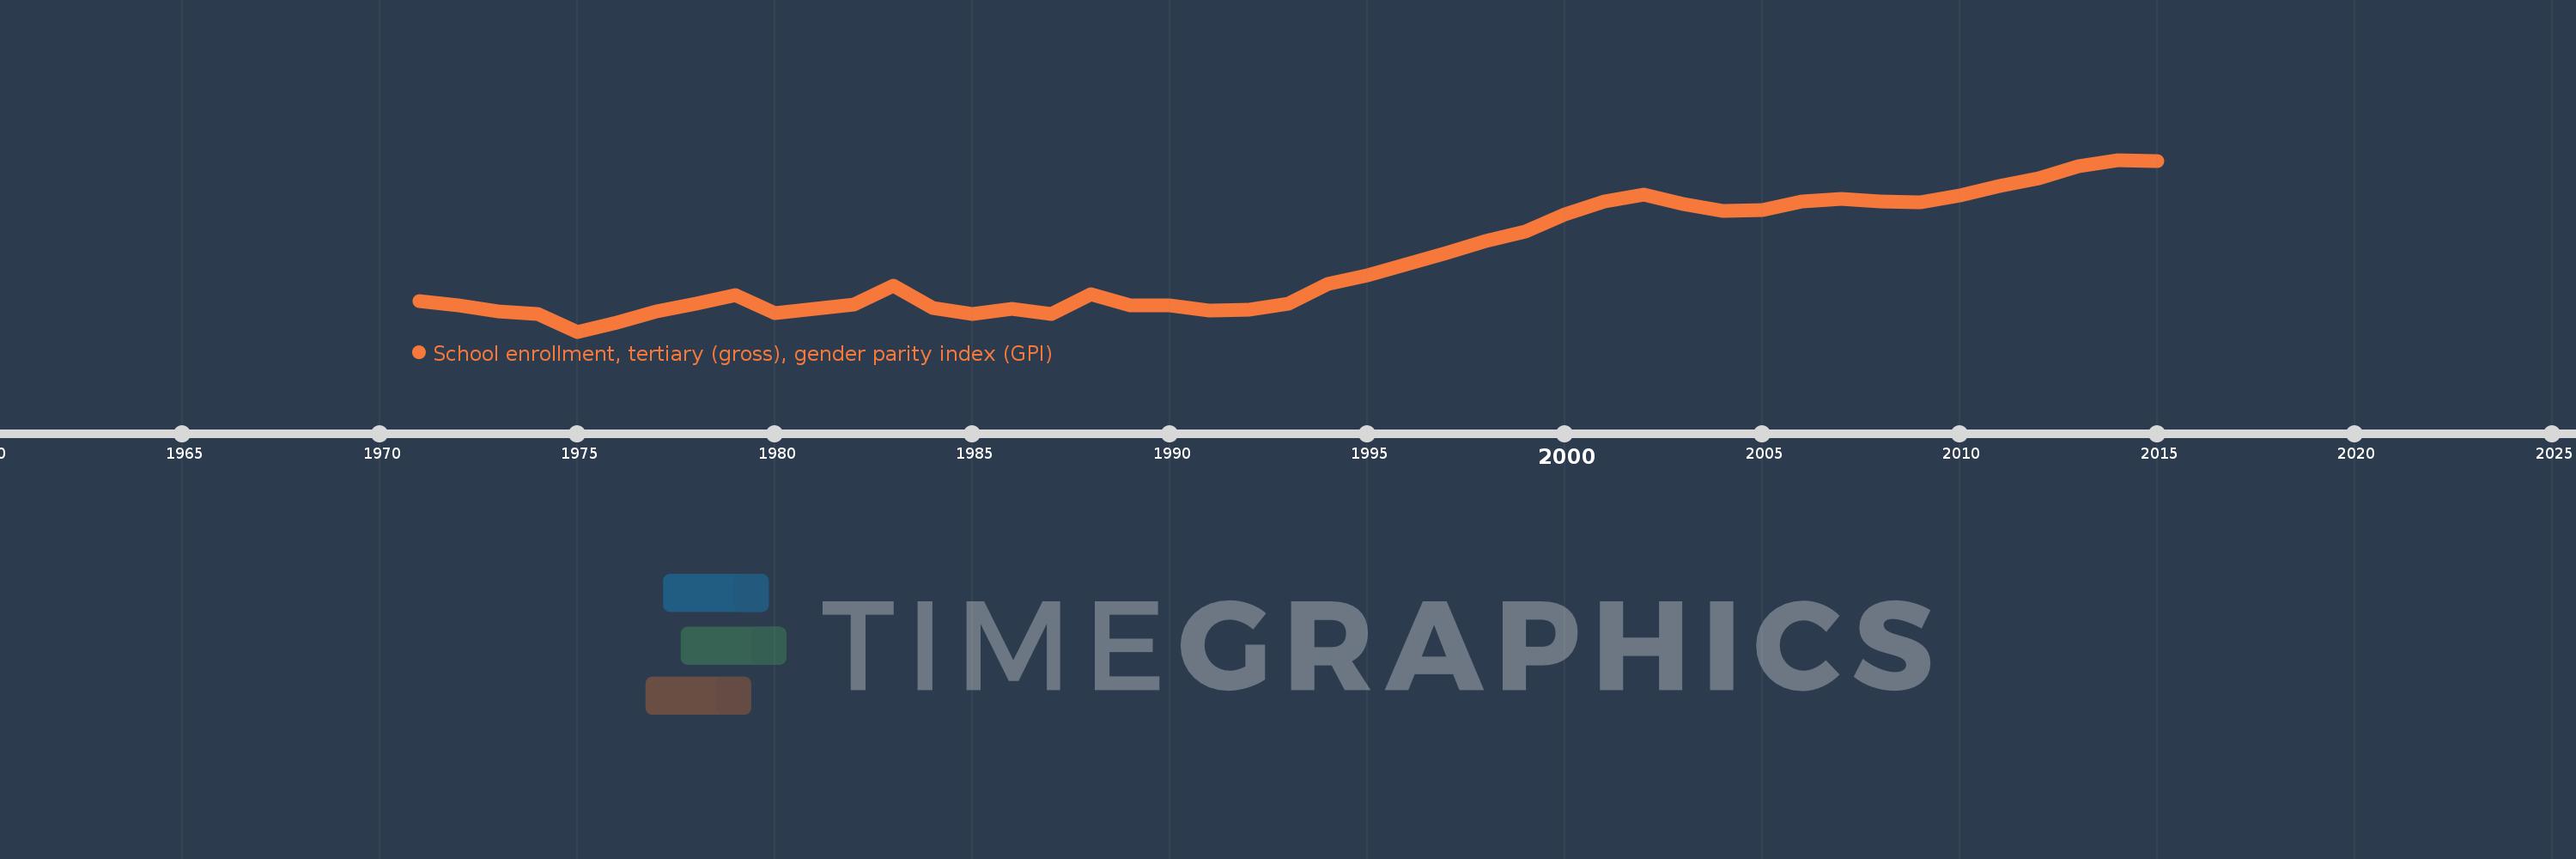
School enrollment, tertiary (gross), gender parity index (GPI)
2015,2014,2013,2012,2011,2010,2009,2008,2007,2006,2005,2004,2003,2002,2001,2000,1999,1998,1997,1996,1995,1994,1993,1992,1991,1990,1989,1988,1987,1986,1985,1984,1983,1982,1981,1980,1979,1978,1977,1976,1975,1974,1973,1972,1971
Estas estadísticas en otros países:
AfghanistanAlbaniaAlgeriaAngolaAntigua and BarbudaArab WorldArgentinaArmeniaArubaAustraliaAustriaAzerbaijanBahamas, TheBahrainBangladeshBarbadosBelarusBelgiumBelizeBeninBermudaBhutanBoliviaBosnia and HerzegovinaBotswanaBrazilBrunei DarussalamBulgariaBurkina FasoBurundiCabo VerdeCambodiaCameroonCanadaCaribbean small statesCentral African RepublicCentral Europe and the BalticsChadChileChinaColombiaComorosCongo, Dem. Rep.Congo, Rep.Costa RicaCote d'IvoireCroatiaCubaCuracaoCyprusCzech RepublicDenmarkDjiboutiDominicaDominican RepublicEarly-demographic dividendEast Asia & PacificEast Asia & Pacific (excluding high income)East Asia & Pacific (IDA & IBRD countries)EcuadorEgypt, Arab Rep.El SalvadorEquatorial GuineaEritreaEstoniaEthiopiaEuro areaEurope & Central AsiaEurope & Central Asia (excluding high income)Europe & Central Asia (IDA & IBRD countries)European UnionFijiFinlandFragile and conflict affected situationsFranceGabonGambia, TheGeorgiaGermanyGhanaGreeceGrenadaGuatemalaGuineaGuinea-BissauGuyanaHaitiHeavily indebted poor countries (HIPC)High incomeHondurasHong Kong SAR, ChinaHungaryIBRD onlyIcelandIDA & IBRD totalIDA blendIDA onlyIDA totalIndiaIndonesiaIran, Islamic Rep.IraqIrelandIsraelItalyJamaicaJapanJordanKazakhstanKenyaKorea, Dem. People’s Rep.Korea, Rep.KuwaitKyrgyz RepublicLao PDRLate-demographic dividendLatin America & Caribbean Latin America & Caribbean (excluding high income)Latin America & the Caribbean (IDA & IBRD countries)LatviaLeast developed countries: UN classificationLebanonLesothoLiberiaLibyaLiechtensteinLithuaniaLow & middle incomeLow incomeLower middle incomeLuxembourgMacao SAR, ChinaMacedonia, FYRMadagascarMalawiMaldivesMaliMaltaMarshall IslandsMauritaniaMauritiusMexicoMicronesia, Fed. Sts.Middle East & North AfricaMiddle East & North Africa (excluding high income)Middle East & North Africa (IDA & IBRD countries)Middle incomeMoldovaMongoliaMontenegroMoroccoMozambiqueMyanmarNamibiaNepalNetherlandsNew ZealandNicaraguaNigerNigeriaNorth AmericaNorwayOECD membersOmanOther small statesPacific island small statesPakistanPalauPanamaPapua New GuineaParaguayPeruPhilippinesPolandPortugalPost-demographic dividendPre-demographic dividendPuerto RicoQatarRomaniaRussian FederationRwandaSamoaSan MarinoSao Tome and PrincipeSaudi ArabiaSenegalSerbiaSeychellesSierra LeoneSingaporeSlovak RepublicSloveniaSmall statesSomaliaSouth AfricaSouth AsiaSouth Asia (IDA & IBRD)SpainSri LankaSt. Kitts and NevisSt. LuciaSt. Vincent and the GrenadinesSub-Saharan Africa Sub-Saharan Africa (excluding high income)Sub-Saharan Africa (IDA & IBRD countries)SudanSurinameSwazilandSwedenSwitzerlandSyrian Arab RepublicTajikistanTanzaniaThailandTimor-LesteTogoTongaTrinidad and TobagoTunisiaTurkeyTurkmenistanUgandaUkraineUnited Arab EmiratesUnited KingdomUnited StatesUpper middle incomeUruguayUzbekistanVanuatuVenezuela, RBVietnamWest Bank and GazaWorldYemen, Rep.ZambiaZimbabwe línea de tiempo (timeline):
En esta escala de tiempo se presenta un gráfico de 1971 y 2015 de Least developed countries: UN classification. Los datos de 1970 están ausentes. El número de observaciones reales por fecha: 45.
Fuente (nombre):
Indicadores del desarrollo mundial
Fuente (organización):
United Nations Educational, Scientific, and Cultural Organization (UNESCO) Institute for Statistics.
Categorías:
Education, Gender, Social Development
Se ha actualizado:
23 abr 2017 año
Los indicadores de los cambios de valor en los últimos años
Mínimo:
0.388
1 ene 1975 año
Máximo:
0.674
1 ene 2014 año
A la fecha de observación
Valor
Cambio absoluto
El cambio con respecto al valor anterior
1 ene 1971 año
0.439
+0.439
0.0%
1 ene 1972 año
0.431
-0.008
-1.93%
1 ene 1973 año
0.421
-0.01
-2.33%
1 ene 1974 año
0.417
-0.004
-0.9%
1 ene 1975 año
0.388
-0.029
-6.88%
1 ene 1976 año
0.403
+0.015
3.78%
1 ene 1977 año
0.421
+0.018
4.53%
1 ene 1978 año
0.435
+0.014
3.34%
1 ene 1979 año
0.449
+0.014
3.3%
1 ene 1980 año
0.419
-0.031
-6.86%
1 ene 1981 año
0.426
+0.008
1.86%
1 ene 1982 año
0.433
+0.007
1.6%
1 ene 1983 año
0.465
+0.032
7.34%
1 ene 1984 año
0.428
-0.037
-7.87%
1 ene 1985 año
0.417
-0.011
-2.62%
1 ene 1986 año
0.426
+0.009
2.07%
1 ene 1987 año
0.417
-0.009
-2.18%
1 ene 1988 año
0.45
+0.034
8.13%
1 ene 1989 año
0.432
-0.018
-4.01%
1 ene 1990 año
0.431
-0.001
-0.21%
1 ene 1991 año
0.423
-0.008
-1.85%
1 ene 1992 año
0.425
+0.002
0.35%
1 ene 1993 año
0.434
+0.009
2.07%
1 ene 1994 año
0.468
+0.035
7.95%
1 ene 1995 año
0.482
+0.014
2.94%
1 ene 1996 año
0.5
+0.018
3.74%
1 ene 1997 año
0.519
+0.019
3.82%
1 ene 1998 año
0.539
+0.02
3.76%
1 ene 1999 año
0.555
+0.016
2.99%
1 ene 2000 año
0.583
+0.029
5.15%
1 ene 2001 año
0.604
+0.021
3.63%
1 ene 2002 año
0.616
+0.011
1.85%
1 ene 2003 año
0.601
-0.014
-2.34%
1 ene 2004 año
0.589
-0.013
-2.09%
1 ene 2005 año
0.59
+0.001
0.19%
1 ene 2006 año
0.605
+0.015
2.57%
1 ene 2007 año
0.609
+0.004
0.66%
1 ene 2008 año
0.604
-0.005
-0.79%
1 ene 2009 año
0.603
-0.001
-0.19%
1 ene 2010 año
0.615
+0.012
2.02%
1 ene 2011 año
0.63
+0.015
2.38%
1 ene 2012 año
0.643
+0.013
2.05%
1 ene 2013 año
0.663
+0.02
3.18%
1 ene 2014 año
0.674
+0.011
1.66%
1 ene 2015 año
0.672
-0.002
-0.32%
Ranking de los países por los datos estadísticos actuales


Comentarios: