29
/es/
es
AIzaSyAYiBZKx7MnpbEhh9jyipgxe19OcubqV5w
April 1, 2024
26117
Central Europe and the Baltics
CEB
false
2
1
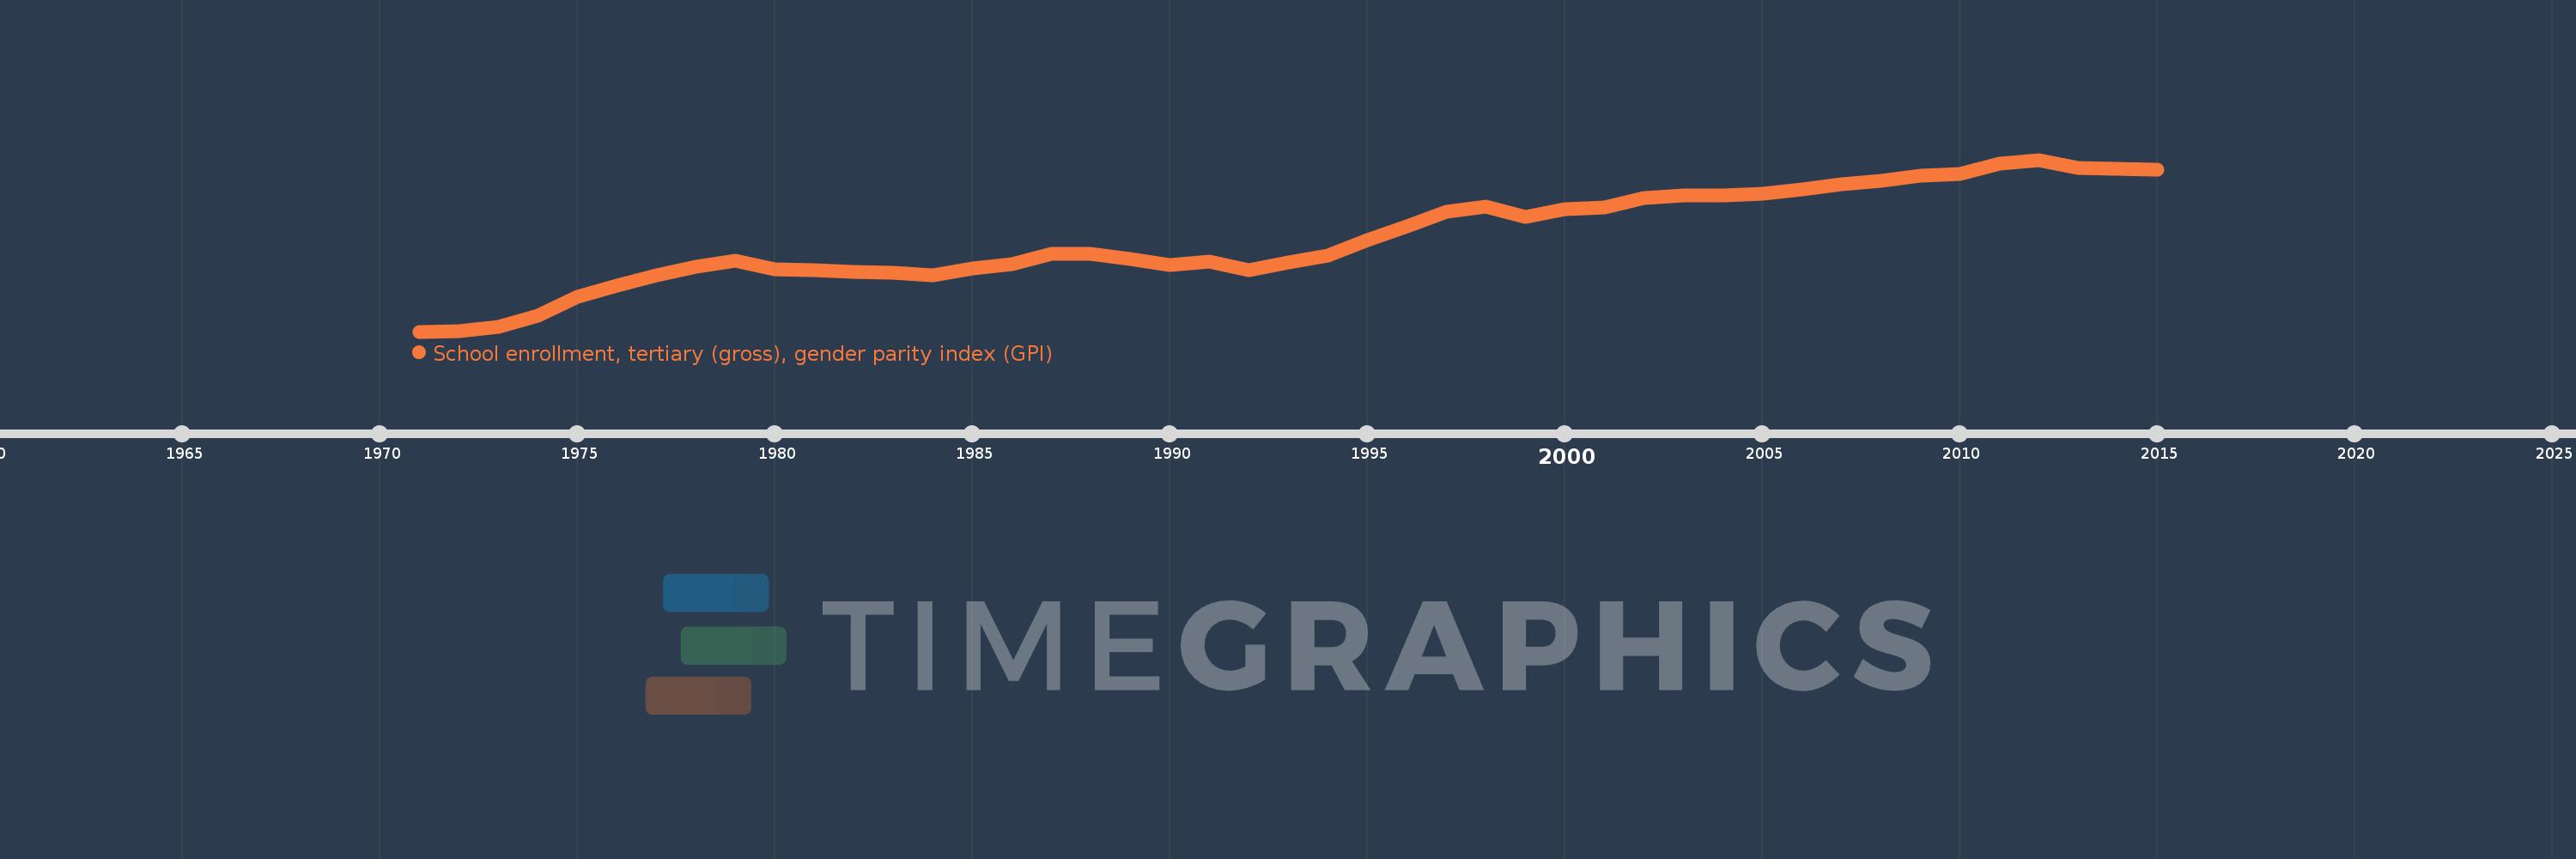
School enrollment, tertiary (gross), gender parity index (GPI)
2015,2014,2013,2012,2011,2010,2009,2008,2007,2006,2005,2004,2003,2002,2001,2000,1999,1998,1997,1996,1995,1994,1993,1992,1991,1990,1989,1988,1987,1986,1985,1984,1983,1982,1981,1980,1979,1978,1977,1976,1975,1974,1973,1972,1971
Estas estadísticas en otros países:
AfghanistanAlbaniaAlgeriaAngolaAntigua and BarbudaArab WorldArgentinaArmeniaArubaAustraliaAustriaAzerbaijanBahamas, TheBahrainBangladeshBarbadosBelarusBelgiumBelizeBeninBermudaBhutanBoliviaBosnia and HerzegovinaBotswanaBrazilBrunei DarussalamBulgariaBurkina FasoBurundiCabo VerdeCambodiaCameroonCanadaCaribbean small statesCentral African RepublicCentral Europe and the BalticsChadChileChinaColombiaComorosCongo, Dem. Rep.Congo, Rep.Costa RicaCote d'IvoireCroatiaCubaCuracaoCyprusCzech RepublicDenmarkDjiboutiDominicaDominican RepublicEarly-demographic dividendEast Asia & PacificEast Asia & Pacific (excluding high income)East Asia & Pacific (IDA & IBRD countries)EcuadorEgypt, Arab Rep.El SalvadorEquatorial GuineaEritreaEstoniaEthiopiaEuro areaEurope & Central AsiaEurope & Central Asia (excluding high income)Europe & Central Asia (IDA & IBRD countries)European UnionFijiFinlandFragile and conflict affected situationsFranceGabonGambia, TheGeorgiaGermanyGhanaGreeceGrenadaGuatemalaGuineaGuinea-BissauGuyanaHaitiHeavily indebted poor countries (HIPC)High incomeHondurasHong Kong SAR, ChinaHungaryIBRD onlyIcelandIDA & IBRD totalIDA blendIDA onlyIDA totalIndiaIndonesiaIran, Islamic Rep.IraqIrelandIsraelItalyJamaicaJapanJordanKazakhstanKenyaKorea, Dem. People’s Rep.Korea, Rep.KuwaitKyrgyz RepublicLao PDRLate-demographic dividendLatin America & Caribbean Latin America & Caribbean (excluding high income)Latin America & the Caribbean (IDA & IBRD countries)LatviaLeast developed countries: UN classificationLebanonLesothoLiberiaLibyaLiechtensteinLithuaniaLow & middle incomeLow incomeLower middle incomeLuxembourgMacao SAR, ChinaMacedonia, FYRMadagascarMalawiMaldivesMaliMaltaMarshall IslandsMauritaniaMauritiusMexicoMicronesia, Fed. Sts.Middle East & North AfricaMiddle East & North Africa (excluding high income)Middle East & North Africa (IDA & IBRD countries)Middle incomeMoldovaMongoliaMontenegroMoroccoMozambiqueMyanmarNamibiaNepalNetherlandsNew ZealandNicaraguaNigerNigeriaNorth AmericaNorwayOECD membersOmanOther small statesPacific island small statesPakistanPalauPanamaPapua New GuineaParaguayPeruPhilippinesPolandPortugalPost-demographic dividendPre-demographic dividendPuerto RicoQatarRomaniaRussian FederationRwandaSamoaSan MarinoSao Tome and PrincipeSaudi ArabiaSenegalSerbiaSeychellesSierra LeoneSingaporeSlovak RepublicSloveniaSmall statesSomaliaSouth AfricaSouth AsiaSouth Asia (IDA & IBRD)SpainSri LankaSt. Kitts and NevisSt. LuciaSt. Vincent and the GrenadinesSub-Saharan Africa Sub-Saharan Africa (excluding high income)Sub-Saharan Africa (IDA & IBRD countries)SudanSurinameSwazilandSwedenSwitzerlandSyrian Arab RepublicTajikistanTanzaniaThailandTimor-LesteTogoTongaTrinidad and TobagoTunisiaTurkeyTurkmenistanUgandaUkraineUnited Arab EmiratesUnited KingdomUnited StatesUpper middle incomeUruguayUzbekistanVanuatuVenezuela, RBVietnamWest Bank and GazaWorldYemen, Rep.ZambiaZimbabwe línea de tiempo (timeline):
En esta escala de tiempo se presenta un gráfico de 1971 y 2015 de Central Europe and the Baltics. Los datos de 1970 están ausentes. El número de observaciones reales por fecha: 45.
Fuente (nombre):
Indicadores del desarrollo mundial
Fuente (organización):
United Nations Educational, Scientific, and Cultural Organization (UNESCO) Institute for Statistics.
Categorías:
Education, Gender, Social Development
Se ha actualizado:
23 abr 2017 año
Los indicadores de los cambios de valor en los últimos años
Mínimo:
0.912
1 ene 1971 año
Máximo:
1.464
1 ene 2012 año
A la fecha de observación
Valor
Cambio absoluto
El cambio con respecto al valor anterior
1 ene 1971 año
0.912
+0.912
0.0%
1 ene 1972 año
0.914
+0.001
0.16%
1 ene 1973 año
0.927
+0.013
1.42%
1 ene 1974 año
0.964
+0.037
4.02%
1 ene 1975 año
1.024
+0.06
6.19%
1 ene 1976 año
1.06
+0.036
3.56%
1 ene 1977 año
1.093
+0.033
3.08%
1 ene 1978 año
1.121
+0.028
2.54%
1 ene 1979 año
1.14
+0.02
1.76%
1 ene 1980 año
1.111
-0.03
-2.59%
1 ene 1981 año
1.108
-0.003
-0.24%
1 ene 1982 año
1.104
-0.004
-0.39%
1 ene 1983 año
1.102
-0.001
-0.13%
1 ene 1984 año
1.093
-0.01
-0.88%
1 ene 1985 año
1.114
+0.021
1.9%
1 ene 1986 año
1.129
+0.015
1.38%
1 ene 1987 año
1.163
+0.034
3.04%
1 ene 1988 año
1.161
-0.003
-0.23%
1 ene 1989 año
1.145
-0.016
-1.37%
1 ene 1990 año
1.127
-0.017
-1.53%
1 ene 1991 año
1.138
+0.011
0.95%
1 ene 1992 año
1.108
-0.03
-2.65%
1 ene 1993 año
1.135
+0.027
2.4%
1 ene 1994 año
1.155
+0.021
1.85%
1 ene 1995 año
1.206
+0.05
4.34%
1 ene 1996 año
1.249
+0.043
3.59%
1 ene 1997 año
1.297
+0.048
3.87%
1 ene 1998 año
1.313
+0.016
1.2%
1 ene 1999 año
1.28
-0.033
-2.5%
1 ene 2000 año
1.304
+0.024
1.88%
1 ene 2001 año
1.312
+0.008
0.62%
1 ene 2002 año
1.342
+0.03
2.25%
1 ene 2003 año
1.35
+0.008
0.6%
1 ene 2004 año
1.35
+0.0
0.03%
1 ene 2005 año
1.356
+0.006
0.42%
1 ene 2006 año
1.369
+0.013
0.92%
1 ene 2007 año
1.386
+0.018
1.3%
1 ene 2008 año
1.397
+0.011
0.78%
1 ene 2009 año
1.414
+0.017
1.24%
1 ene 2010 año
1.419
+0.005
0.35%
1 ene 2011 año
1.451
+0.032
2.27%
1 ene 2012 año
1.464
+0.013
0.88%
1 ene 2013 año
1.439
-0.025
-1.7%
1 ene 2014 año
1.434
-0.005
-0.37%
1 ene 2015 año
1.431
-0.003
-0.2%
Ranking de los países por los datos estadísticos actuales


Comentarios: