29
/es/
es
AIzaSyAYiBZKx7MnpbEhh9jyipgxe19OcubqV5w
April 1, 2024
43313
Latin America & the Caribbean (IDA & IBRD countries)
TLA
false
2
1
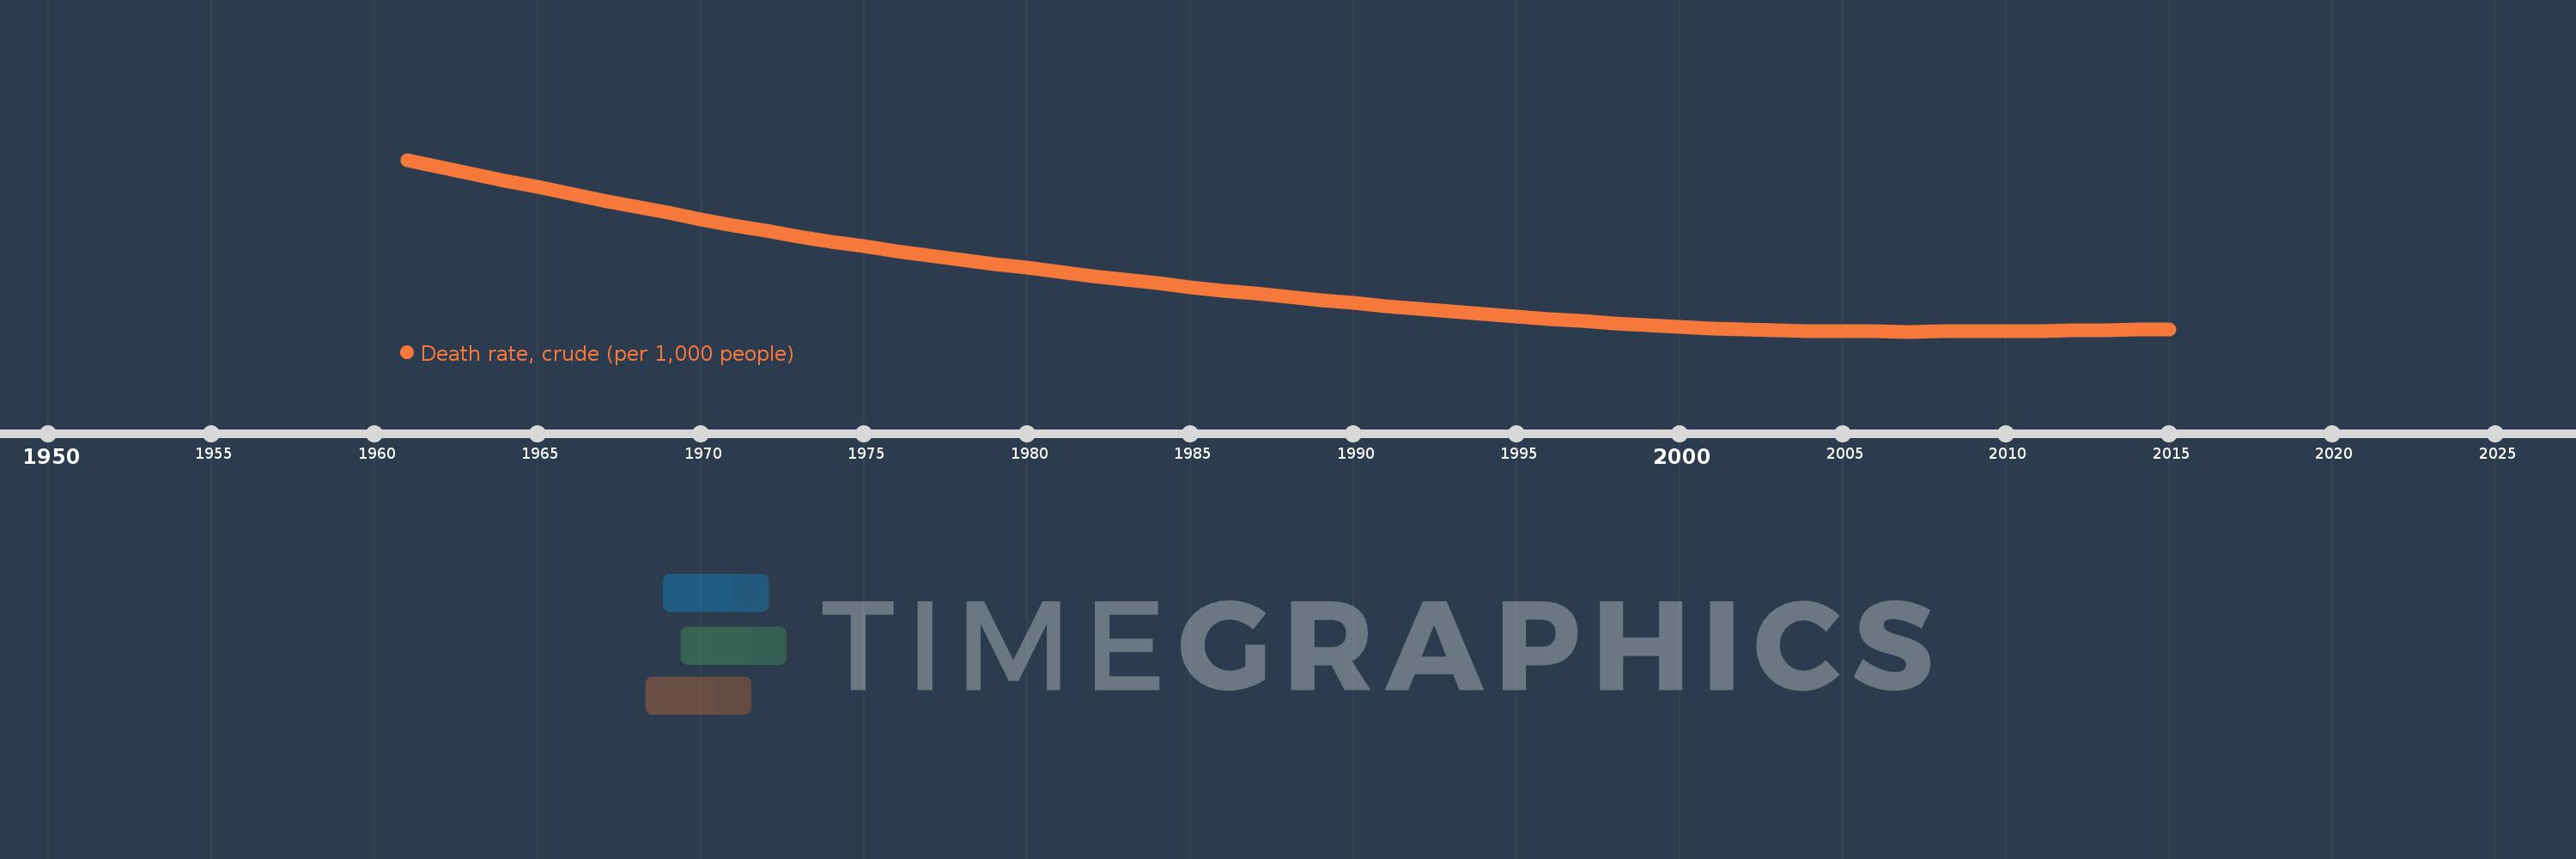
Death rate, crude (per 1,000 people)
2015,2014,2013,2012,2011,2010,2009,2008,2007,2006,2005,2004,2003,2002,2001,2000,1999,1998,1997,1996,1995,1994,1993,1992,1991,1990,1989,1988,1987,1986,1985,1984,1983,1982,1981,1980,1979,1978,1977,1976,1975,1974,1973,1972,1971,1970,1969,1968,1967,1966,1965,1964,1963,1962,1961
Estas estadísticas en otros países:
AfghanistanAlbaniaAlgeriaAmerican SamoaAndorraAngolaAntigua and BarbudaArab WorldArgentinaArmeniaArubaAustraliaAustriaAzerbaijanBahamas, TheBahrainBangladeshBarbadosBelarusBelgiumBelizeBeninBermudaBhutanBoliviaBosnia and HerzegovinaBotswanaBrazilBrunei DarussalamBulgariaBurkina FasoBurundiCabo VerdeCambodiaCameroonCanadaCaribbean small statesCayman IslandsCentral African RepublicCentral Europe and the BalticsChadChannel IslandsChileChinaColombiaComorosCongo, Dem. Rep.Congo, Rep.Costa RicaCote d'IvoireCroatiaCubaCuracaoCyprusCzech RepublicDenmarkDjiboutiDominicaDominican RepublicEarly-demographic dividendEast Asia & PacificEast Asia & Pacific (excluding high income)East Asia & Pacific (IDA & IBRD countries)EcuadorEgypt, Arab Rep.El SalvadorEquatorial GuineaEritreaEstoniaEthiopiaEuro areaEurope & Central AsiaEurope & Central Asia (excluding high income)Europe & Central Asia (IDA & IBRD countries)European UnionFaroe IslandsFijiFinlandFragile and conflict affected situationsFranceFrench PolynesiaGabonGambia, TheGeorgiaGermanyGhanaGreeceGreenlandGrenadaGuamGuatemalaGuineaGuinea-BissauGuyanaHaitiHeavily indebted poor countries (HIPC)High incomeHondurasHong Kong SAR, ChinaHungaryIBRD onlyIcelandIDA & IBRD totalIDA blendIDA onlyIDA totalIndiaIndonesiaIran, Islamic Rep.IraqIrelandIsle of ManIsraelItalyJamaicaJapanJordanKazakhstanKenyaKiribatiKorea, Dem. People’s Rep.Korea, Rep.KosovoKuwaitKyrgyz RepublicLao PDRLate-demographic dividendLatin America & Caribbean Latin America & Caribbean (excluding high income)Latin America & the Caribbean (IDA & IBRD countries)LatviaLeast developed countries: UN classificationLebanonLesothoLiberiaLibyaLiechtensteinLithuaniaLow & middle incomeLow incomeLower middle incomeLuxembourgMacao SAR, ChinaMacedonia, FYRMadagascarMalawiMalaysiaMaldivesMaliMaltaMarshall IslandsMauritaniaMauritiusMexicoMicronesia, Fed. Sts.Middle East & North AfricaMiddle East & North Africa (excluding high income)Middle East & North Africa (IDA & IBRD countries)Middle incomeMoldovaMonacoMongoliaMontenegroMoroccoMozambiqueMyanmarNamibiaNepalNetherlandsNew CaledoniaNew ZealandNicaraguaNigerNigeriaNorth AmericaNorwayOECD membersOmanOther small statesPacific island small statesPakistanPalauPanamaPapua New GuineaParaguayPeruPhilippinesPolandPortugalPost-demographic dividendPre-demographic dividendPuerto RicoQatarRomaniaRussian FederationRwandaSamoaSan MarinoSao Tome and PrincipeSaudi ArabiaSenegalSerbiaSeychellesSierra LeoneSingaporeSint Maarten (Dutch part)Slovak RepublicSloveniaSmall statesSolomon IslandsSomaliaSouth AfricaSouth AsiaSouth Asia (IDA & IBRD)South SudanSpainSri LankaSt. Kitts and NevisSt. LuciaSt. Martin (French part)St. Vincent and the GrenadinesSub-Saharan Africa Sub-Saharan Africa (excluding high income)Sub-Saharan Africa (IDA & IBRD countries)SudanSurinameSwazilandSwedenSwitzerlandSyrian Arab RepublicTajikistanTanzaniaThailandTimor-LesteTogoTongaTrinidad and TobagoTunisiaTurkeyTurkmenistanUgandaUkraineUnited Arab EmiratesUnited KingdomUnited StatesUpper middle incomeUruguayUzbekistanVanuatuVenezuela, RBVietnamVirgin Islands (U.S.)West Bank and GazaWorldYemen, Rep.ZambiaZimbabwe línea de tiempo (timeline):
En esta escala de tiempo se presenta un gráfico de 1961 y 2015 de Latin America & the Caribbean (IDA & IBRD countries). Los datos de 1960 están ausentes. El número de observaciones reales por fecha: 55.
Fuente (nombre):
Indicadores del desarrollo mundial
Fuente (organización):
(1) United Nations Population Division. World Population Prospects, (2) Census reports and other statistical publications from national statistical offices, (3) Eurostat: Demographic Statistics, (4) United Nations Statistical Division. Population and Vital Statistics Reprot (various years), (5) U.S. Census Bureau: International Database, and (6) Secretariat of the Pacific Community: Statistics and Demography Programme.
Categorías:
Health
Se ha actualizado:
23 abr 2017 año
Los indicadores de los cambios de valor en los últimos años
Mínimo:
5.75
1 ene 2007 año
Máximo:
13.23
1 ene 1961 año
A la fecha de observación
Valor
Cambio absoluto
El cambio con respecto al valor anterior
1 ene 1961 año
13.23
+13.23
0.0%
1 ene 1962 año
12.919
-0.311
-2.35%
1 ene 1963 año
12.617
-0.302
-2.34%
1 ene 1964 año
12.323
-0.294
-2.33%
1 ene 1965 año
12.035
-0.288
-2.34%
1 ene 1966 año
11.751
-0.284
-2.36%
1 ene 1967 año
11.47
-0.281
-2.39%
1 ene 1968 año
11.192
-0.278
-2.42%
1 ene 1969 año
10.917
-0.275
-2.45%
1 ene 1970 año
10.647
-0.27
-2.47%
1 ene 1971 año
10.385
-0.262
-2.46%
1 ene 1972 año
10.133
-0.252
-2.43%
1 ene 1973 año
9.894
-0.239
-2.36%
1 ene 1974 año
9.668
-0.226
-2.28%
1 ene 1975 año
9.456
-0.212
-2.19%
1 ene 1976 año
9.256
-0.2
-2.12%
1 ene 1977 año
9.065
-0.191
-2.07%
1 ene 1978 año
8.881
-0.183
-2.02%
1 ene 1979 año
8.701
-0.18
-2.03%
1 ene 1980 año
8.525
-0.177
-2.03%
1 ene 1981 año
8.35
-0.174
-2.04%
1 ene 1982 año
8.179
-0.172
-2.06%
1 ene 1983 año
8.012
-0.167
-2.04%
1 ene 1984 año
7.85
-0.162
-2.02%
1 ene 1985 año
7.693
-0.157
-2.0%
1 ene 1986 año
7.543
-0.15
-1.95%
1 ene 1987 año
7.398
-0.144
-1.92%
1 ene 1988 año
7.26
-0.138
-1.87%
1 ene 1989 año
7.128
-0.132
-1.82%
1 ene 1990 año
7.001
-0.127
-1.78%
1 ene 1991 año
6.87
-0.13
-1.86%
1 ene 1992 año
6.748
-0.122
-1.78%
1 ene 1993 año
6.63
-0.118
-1.75%
1 ene 1994 año
6.516
-0.114
-1.72%
1 ene 1995 año
6.403
-0.113
-1.73%
1 ene 1996 año
6.3
-0.104
-1.62%
1 ene 1997 año
6.201
-0.098
-1.56%
1 ene 1998 año
6.105
-0.097
-1.56%
1 ene 1999 año
6.023
-0.081
-1.33%
1 ene 2000 año
5.954
-0.069
-1.15%
1 ene 2001 año
5.891
-0.062
-1.05%
1 ene 2002 año
5.844
-0.047
-0.8%
1 ene 2003 año
5.808
-0.036
-0.62%
1 ene 2004 año
5.782
-0.027
-0.46%
1 ene 2005 año
5.761
-0.02
-0.35%
1 ene 2006 año
5.752
-0.01
-0.17%
1 ene 2007 año
5.75
-0.002
-0.03%
1 ene 2008 año
5.754
+0.004
0.06%
1 ene 2009 año
5.758
+0.005
0.08%
1 ene 2010 año
5.766
+0.008
0.13%
1 ene 2011 año
5.784
+0.018
0.3%
1 ene 2012 año
5.791
+0.007
0.12%
1 ene 2013 año
5.809
+0.018
0.31%
1 ene 2014 año
5.826
+0.017
0.3%
1 ene 2015 año
5.848
+0.022
0.38%
Ranking de los países por los datos estadísticos actuales


Comentarios: