29
/es/
es
AIzaSyAYiBZKx7MnpbEhh9jyipgxe19OcubqV5w
April 1, 2024
185024
Madagascar
MDG
true
2
1
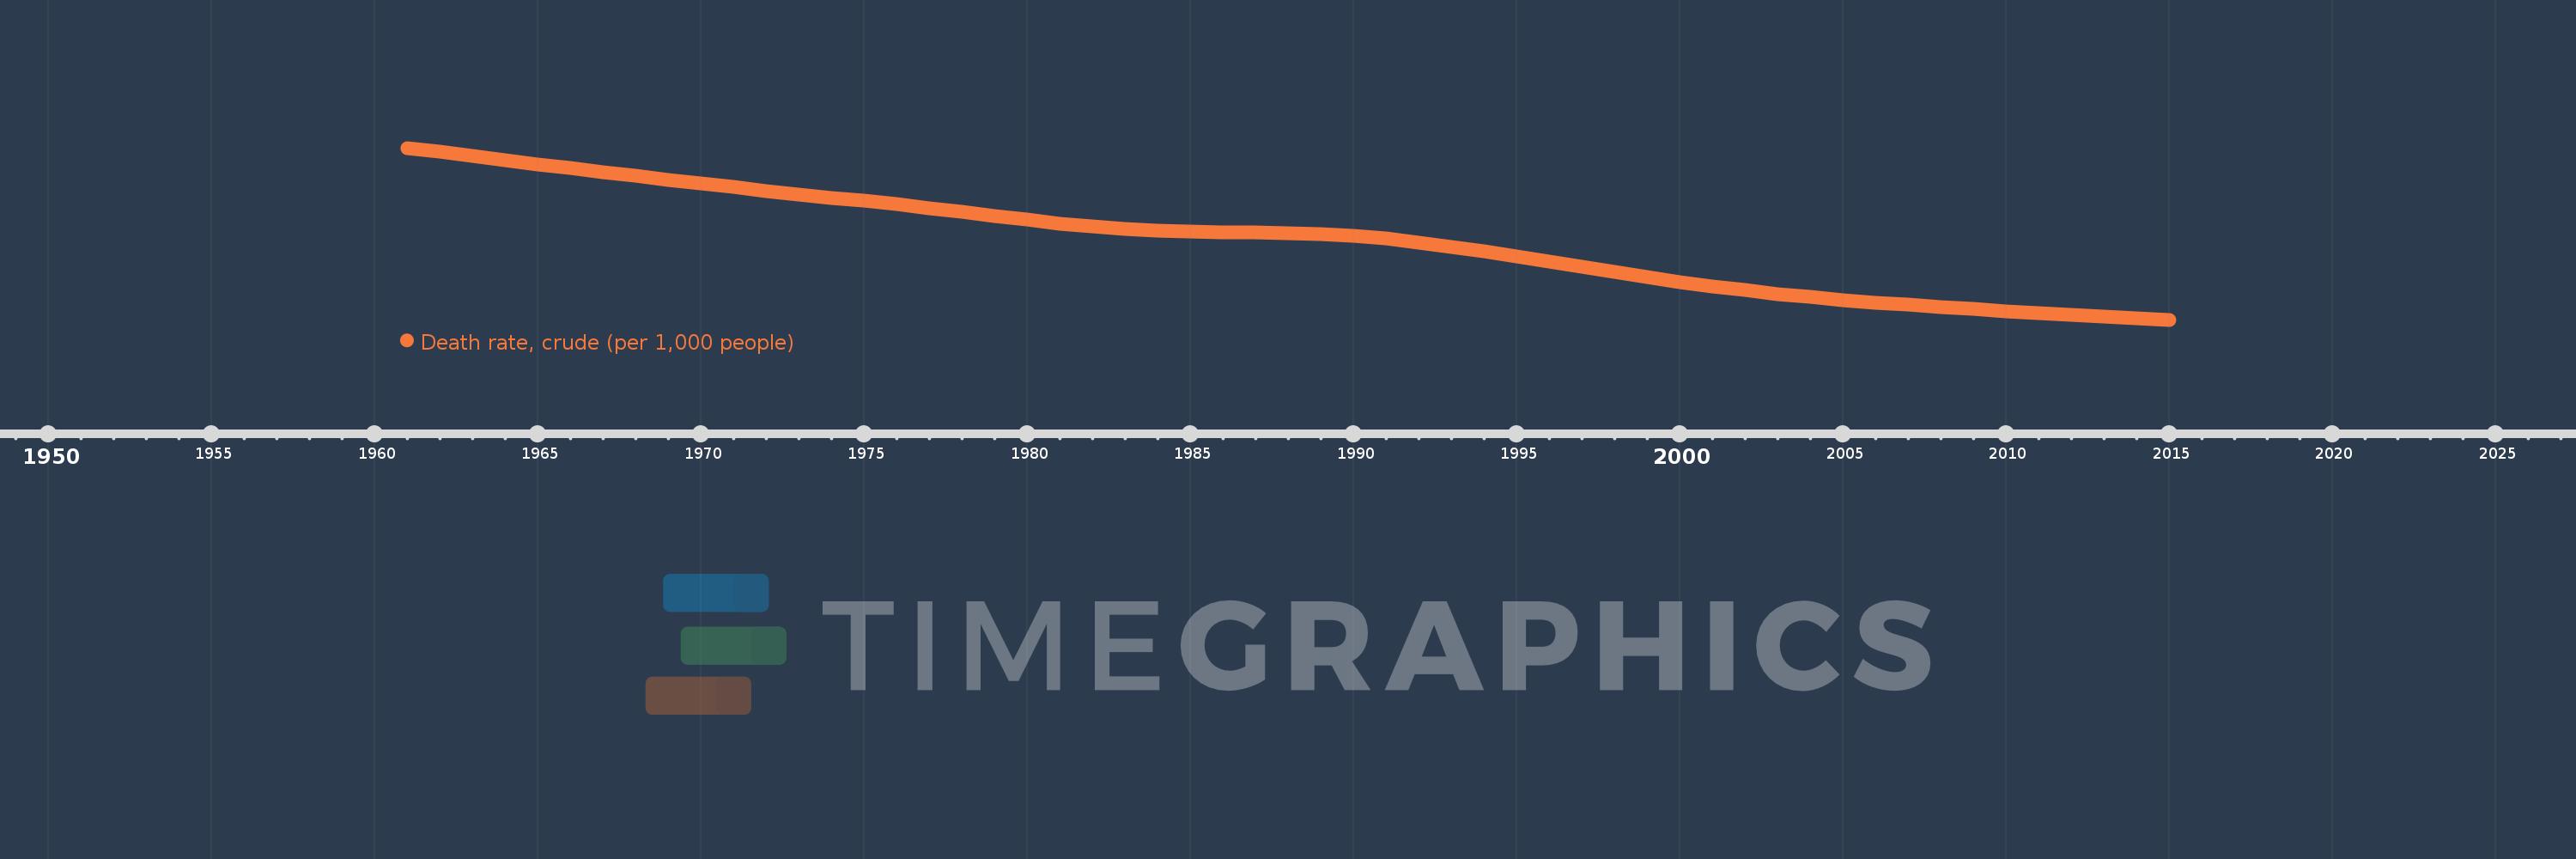
Death rate, crude (per 1,000 people)
2015,2014,2013,2012,2011,2010,2009,2008,2007,2006,2005,2004,2003,2002,2001,2000,1999,1998,1997,1996,1995,1994,1993,1992,1991,1990,1989,1988,1987,1986,1985,1984,1983,1982,1981,1980,1979,1978,1977,1976,1975,1974,1973,1972,1971,1970,1969,1968,1967,1966,1965,1964,1963,1962,1961
Estas estadísticas en otros países:
AfghanistanAlbaniaAlgeriaAmerican SamoaAndorraAngolaAntigua and BarbudaArab WorldArgentinaArmeniaArubaAustraliaAustriaAzerbaijanBahamas, TheBahrainBangladeshBarbadosBelarusBelgiumBelizeBeninBermudaBhutanBoliviaBosnia and HerzegovinaBotswanaBrazilBrunei DarussalamBulgariaBurkina FasoBurundiCabo VerdeCambodiaCameroonCanadaCaribbean small statesCayman IslandsCentral African RepublicCentral Europe and the BalticsChadChannel IslandsChileChinaColombiaComorosCongo, Dem. Rep.Congo, Rep.Costa RicaCote d'IvoireCroatiaCubaCuracaoCyprusCzech RepublicDenmarkDjiboutiDominicaDominican RepublicEarly-demographic dividendEast Asia & PacificEast Asia & Pacific (excluding high income)East Asia & Pacific (IDA & IBRD countries)EcuadorEgypt, Arab Rep.El SalvadorEquatorial GuineaEritreaEstoniaEthiopiaEuro areaEurope & Central AsiaEurope & Central Asia (excluding high income)Europe & Central Asia (IDA & IBRD countries)European UnionFaroe IslandsFijiFinlandFragile and conflict affected situationsFranceFrench PolynesiaGabonGambia, TheGeorgiaGermanyGhanaGreeceGreenlandGrenadaGuamGuatemalaGuineaGuinea-BissauGuyanaHaitiHeavily indebted poor countries (HIPC)High incomeHondurasHong Kong SAR, ChinaHungaryIBRD onlyIcelandIDA & IBRD totalIDA blendIDA onlyIDA totalIndiaIndonesiaIran, Islamic Rep.IraqIrelandIsle of ManIsraelItalyJamaicaJapanJordanKazakhstanKenyaKiribatiKorea, Dem. People’s Rep.Korea, Rep.KosovoKuwaitKyrgyz RepublicLao PDRLate-demographic dividendLatin America & Caribbean Latin America & Caribbean (excluding high income)Latin America & the Caribbean (IDA & IBRD countries)LatviaLeast developed countries: UN classificationLebanonLesothoLiberiaLibyaLiechtensteinLithuaniaLow & middle incomeLow incomeLower middle incomeLuxembourgMacao SAR, ChinaMacedonia, FYRMadagascarMalawiMalaysiaMaldivesMaliMaltaMarshall IslandsMauritaniaMauritiusMexicoMicronesia, Fed. Sts.Middle East & North AfricaMiddle East & North Africa (excluding high income)Middle East & North Africa (IDA & IBRD countries)Middle incomeMoldovaMonacoMongoliaMontenegroMoroccoMozambiqueMyanmarNamibiaNepalNetherlandsNew CaledoniaNew ZealandNicaraguaNigerNigeriaNorth AmericaNorwayOECD membersOmanOther small statesPacific island small statesPakistanPalauPanamaPapua New GuineaParaguayPeruPhilippinesPolandPortugalPost-demographic dividendPre-demographic dividendPuerto RicoQatarRomaniaRussian FederationRwandaSamoaSan MarinoSao Tome and PrincipeSaudi ArabiaSenegalSerbiaSeychellesSierra LeoneSingaporeSint Maarten (Dutch part)Slovak RepublicSloveniaSmall statesSolomon IslandsSomaliaSouth AfricaSouth AsiaSouth Asia (IDA & IBRD)South SudanSpainSri LankaSt. Kitts and NevisSt. LuciaSt. Martin (French part)St. Vincent and the GrenadinesSub-Saharan Africa Sub-Saharan Africa (excluding high income)Sub-Saharan Africa (IDA & IBRD countries)SudanSurinameSwazilandSwedenSwitzerlandSyrian Arab RepublicTajikistanTanzaniaThailandTimor-LesteTogoTongaTrinidad and TobagoTunisiaTurkeyTurkmenistanUgandaUkraineUnited Arab EmiratesUnited KingdomUnited StatesUpper middle incomeUruguayUzbekistanVanuatuVenezuela, RBVietnamVirgin Islands (U.S.)West Bank and GazaWorldYemen, Rep.ZambiaZimbabwe línea de tiempo (timeline):
En esta escala de tiempo se presenta un gráfico de 1961 y 2015 de Madagascar. Los datos de 1960 están ausentes. El número de observaciones reales por fecha: 55.
Fuente (nombre):
Indicadores del desarrollo mundial
Fuente (organización):
(1) United Nations Population Division. World Population Prospects, (2) Census reports and other statistical publications from national statistical offices, (3) Eurostat: Demographic Statistics, (4) United Nations Statistical Division. Population and Vital Statistics Reprot (various years), (5) U.S. Census Bureau: International Database, and (6) Secretariat of the Pacific Community: Statistics and Demography Programme.
Categorías:
Health
Se ha actualizado:
23 abr 2017 año
Los indicadores de los cambios de valor en los últimos años
Mínimo:
6.674
1 ene 2015 año
Máximo:
24.851
1 ene 1961 año
A la fecha de observación
Valor
Cambio absoluto
El cambio con respecto al valor anterior
1 ene 1961 año
24.851
+24.851
0.0%
1 ene 1962 año
24.419
-0.432
-1.74%
1 ene 1963 año
23.984
-0.435
-1.78%
1 ene 1964 año
23.551
-0.433
-1.81%
1 ene 1965 año
23.121
-0.43
-1.83%
1 ene 1966 año
22.698
-0.423
-1.83%
1 ene 1967 año
22.282
-0.416
-1.83%
1 ene 1968 año
21.873
-0.409
-1.84%
1 ene 1969 año
21.471
-0.402
-1.84%
1 ene 1970 año
21.076
-0.395
-1.84%
1 ene 1971 año
20.69
-0.386
-1.83%
1 ene 1972 año
20.315
-0.375
-1.81%
1 ene 1973 año
19.949
-0.366
-1.8%
1 ene 1974 año
19.591
-0.358
-1.79%
1 ene 1975 año
19.238
-0.353
-1.8%
1 ene 1976 año
18.879
-0.359
-1.87%
1 ene 1977 año
18.502
-0.377
-2.0%
1 ene 1978 año
18.103
-0.399
-2.16%
1 ene 1979 año
17.688
-0.415
-2.29%
1 ene 1980 año
17.267
-0.421
-2.38%
1 ene 1981 año
16.87
-0.397
-2.3%
1 ene 1982 año
16.532
-0.338
-2.0%
1 ene 1983 año
16.273
-0.259
-1.57%
1 ene 1984 año
16.1
-0.173
-1.06%
1 ene 1985 año
16.002
-0.098
-0.61%
1 ene 1986 año
15.955
-0.047
-0.29%
1 ene 1987 año
15.923
-0.032
-0.2%
1 ene 1988 año
15.863
-0.06
-0.38%
1 ene 1989 año
15.74
-0.123
-0.78%
1 ene 1990 año
15.537
-0.203
-1.29%
1 ene 1991 año
15.24
-0.297
-1.91%
1 ene 1992 año
14.851
-0.389
-2.55%
1 ene 1993 año
14.393
-0.458
-3.08%
1 ene 1994 año
13.891
-0.502
-3.49%
1 ene 1995 año
13.358
-0.533
-3.84%
1 ene 1996 año
12.809
-0.549
-4.11%
1 ene 1997 año
12.255
-0.554
-4.33%
1 ene 1998 año
11.707
-0.548
-4.47%
1 ene 1999 año
11.175
-0.532
-4.54%
1 ene 2000 año
10.671
-0.504
-4.51%
1 ene 2001 año
10.206
-0.465
-4.36%
1 ene 2002 año
9.786
-0.42
-4.12%
1 ene 2003 año
9.408
-0.378
-3.86%
1 ene 2004 año
9.067
-0.341
-3.62%
1 ene 2005 año
8.763
-0.304
-3.35%
1 ene 2006 año
8.49
-0.273
-3.12%
1 ene 2007 año
8.244
-0.246
-2.9%
1 ene 2008 año
8.017
-0.227
-2.75%
1 ene 2009 año
7.801
-0.216
-2.69%
1 ene 2010 año
7.594
-0.207
-2.65%
1 ene 2011 año
7.393
-0.201
-2.65%
1 ene 2012 año
7.198
-0.195
-2.64%
1 ene 2013 año
7.013
-0.185
-2.57%
1 ene 2014 año
6.838
-0.175
-2.5%
1 ene 2015 año
6.674
-0.164
-2.4%
Ranking de los países por los datos estadísticos actuales


Comentarios: