29
/es/
es
AIzaSyAYiBZKx7MnpbEhh9jyipgxe19OcubqV5w
April 1, 2024
42279
Latin America & Caribbean (excluding high income)
LAC
false
2
1
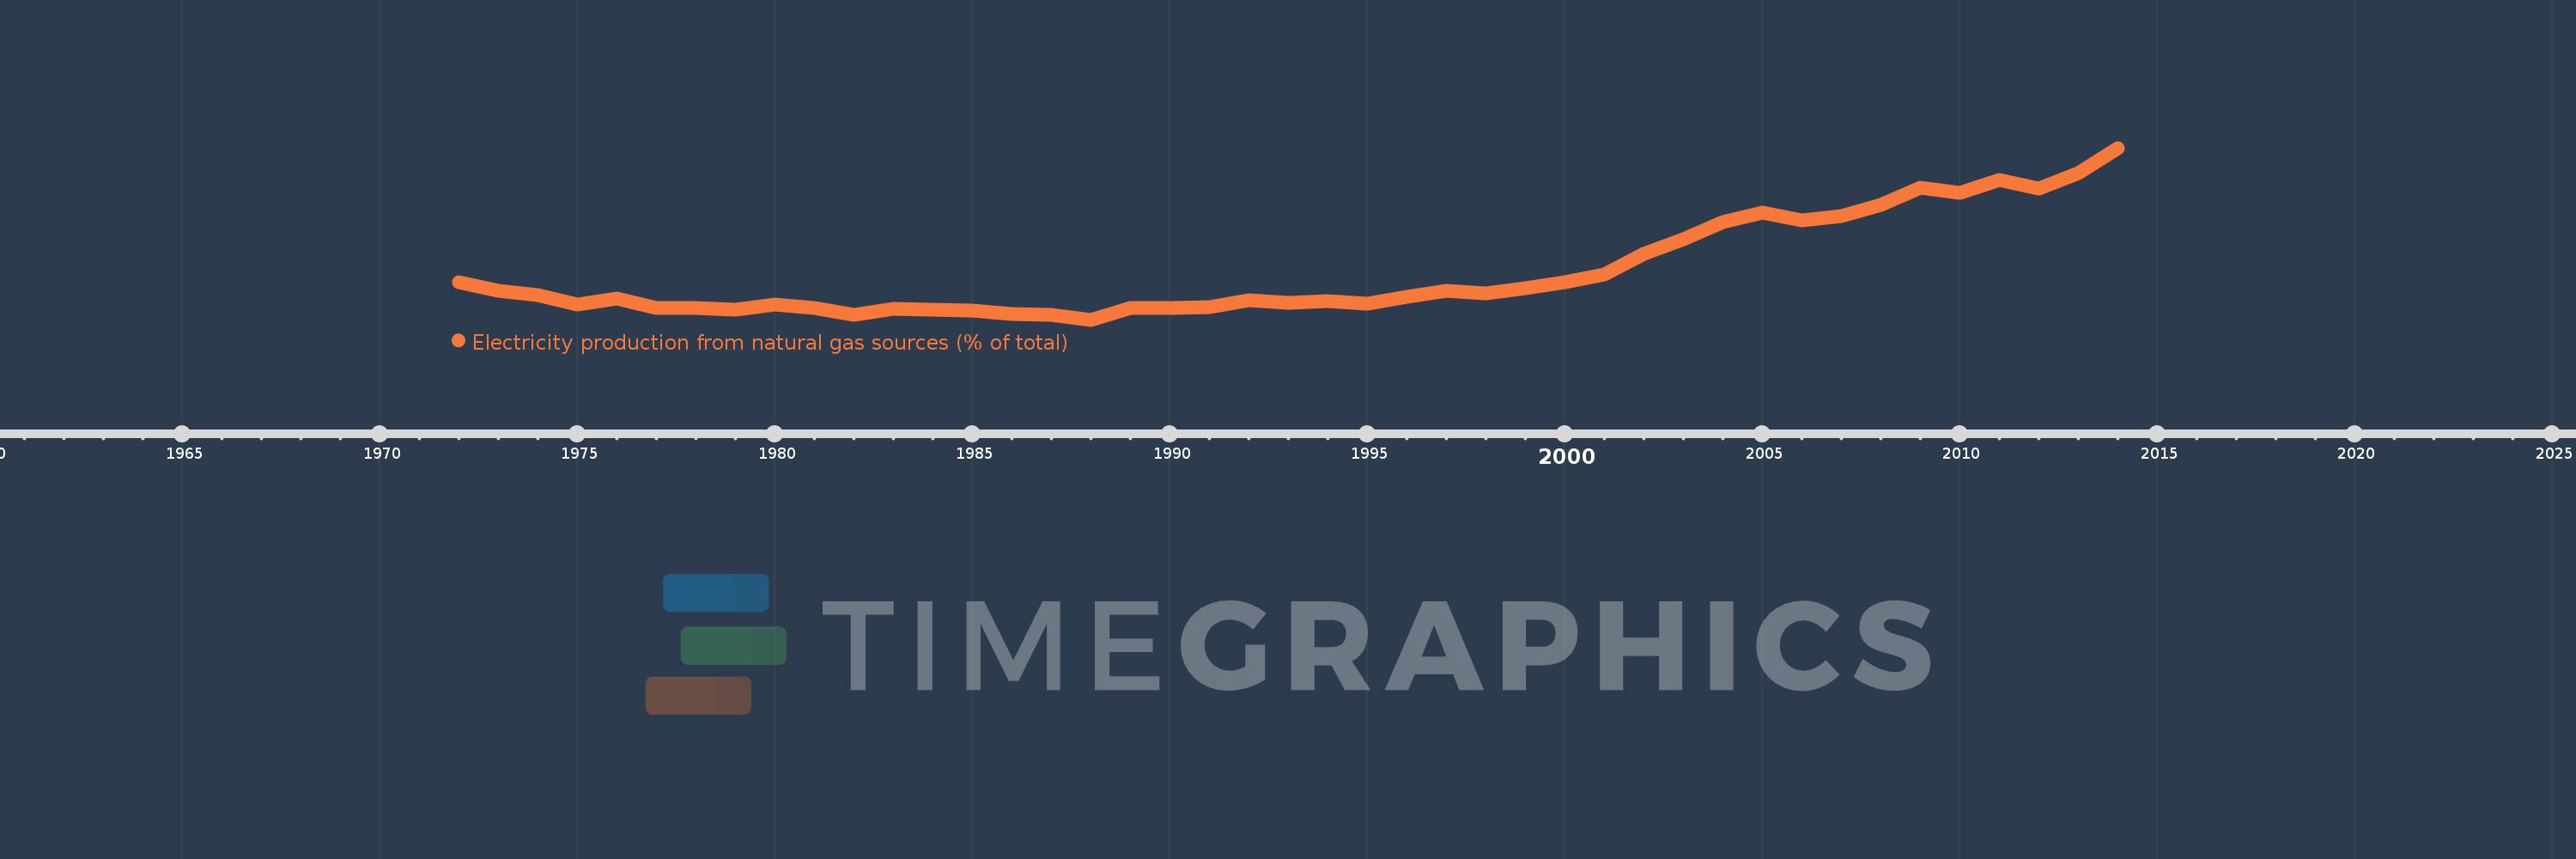
Electricity production from natural gas sources (% of total)
2014,2013,2012,2011,2010,2009,2008,2007,2006,2005,2004,2003,2002,2001,2000,1999,1998,1997,1996,1995,1994,1993,1992,1991,1990,1989,1988,1987,1986,1985,1984,1983,1982,1981,1980,1979,1978,1977,1976,1975,1974,1973,1972
Estas estadísticas en otros países:
AlbaniaAlgeriaAngolaArab WorldArgentinaArmeniaAustraliaAustriaAzerbaijanBahrainBangladeshBelarusBelgiumBeninBoliviaBosnia and HerzegovinaBotswanaBrazilBrunei DarussalamBulgariaCambodiaCameroonCanadaCentral Europe and the BalticsChileChinaColombiaCongo, Dem. Rep.Congo, Rep.Costa RicaCote d'IvoireCroatiaCubaCuracaoCyprusCzech RepublicDenmarkDominican RepublicEarly-demographic dividendEast Asia & PacificEast Asia & Pacific (excluding high income)East Asia & Pacific (IDA & IBRD countries)EcuadorEgypt, Arab Rep.El SalvadorEritreaEstoniaEthiopiaEuro areaEurope & Central AsiaEurope & Central Asia (excluding high income)Europe & Central Asia (IDA & IBRD countries)European UnionFinlandFragile and conflict affected situationsFranceGabonGeorgiaGermanyGhanaGibraltarGreeceGuatemalaHaitiHeavily indebted poor countries (HIPC)High incomeHondurasHong Kong SAR, ChinaHungaryIBRD onlyIcelandIDA & IBRD totalIDA blendIDA onlyIDA totalIndiaIndonesiaIran, Islamic Rep.IraqIrelandIsraelItalyJamaicaJapanJordanKazakhstanKenyaKorea, Dem. People’s Rep.Korea, Rep.KosovoKuwaitKyrgyz RepublicLate-demographic dividendLatin America & Caribbean Latin America & Caribbean (excluding high income)Latin America & the Caribbean (IDA & IBRD countries)LatviaLeast developed countries: UN classificationLebanonLibyaLithuaniaLow & middle incomeLower middle incomeLuxembourgMacedonia, FYRMalaysiaMaltaMauritiusMexicoMiddle East & North AfricaMiddle East & North Africa (excluding high income)Middle East & North Africa (IDA & IBRD countries)Middle incomeMoldovaMongoliaMontenegroMoroccoMozambiqueMyanmarNamibiaNepalNetherlandsNew ZealandNicaraguaNigerNigeriaNorth AmericaNorwayOECD membersOmanOther small statesPakistanPanamaParaguayPeruPhilippinesPolandPortugalPost-demographic dividendPre-demographic dividendQatarRomaniaRussian FederationSaudi ArabiaSenegalSerbiaSingaporeSlovak RepublicSloveniaSmall statesSouth AfricaSouth AsiaSouth Asia (IDA & IBRD)South SudanSpainSri LankaSub-Saharan Africa Sub-Saharan Africa (excluding high income)Sub-Saharan Africa (IDA & IBRD countries)SudanSwedenSwitzerlandSyrian Arab RepublicTajikistanTanzaniaThailandTogoTrinidad and TobagoTunisiaTurkeyTurkmenistanUkraineUnited Arab EmiratesUnited KingdomUnited StatesUpper middle incomeUruguayUzbekistanVenezuela, RBVietnamWorldYemen, Rep.ZambiaZimbabwe línea de tiempo (timeline):
En esta escala de tiempo se presenta un gráfico de 1972 y 2014 de Latin America & Caribbean (excluding high income). Los datos de 1971 están ausentes. El número de observaciones reales por fecha: 43.
Fuente (nombre):
Indicadores del desarrollo mundial
Fuente (organización):
IEA Statistics © OECD/IEA 2014 (http://www.iea.org/stats/index.asp), subject to https://www.iea.org/t&c/termsandconditions/
Categorías:
Energy & Mining, Climate Change, Infrastructure
Se ha actualizado:
23 abr 2017 año
Los indicadores de los cambios de valor en los últimos años
Mínimo:
8.418
1 ene 1988 año
Máximo:
26.342
1 ene 2014 año
A la fecha de observación
Valor
Cambio absoluto
El cambio con respecto al valor anterior
1 ene 1972 año
12.373
+12.373
0.0%
1 ene 1973 año
11.466
-0.907
-7.33%
1 ene 1974 año
10.978
-0.488
-4.26%
1 ene 1975 año
10.008
-0.97
-8.83%
1 ene 1976 año
10.653
+0.644
6.44%
1 ene 1977 año
9.656
-0.997
-9.36%
1 ene 1978 año
9.658
+0.002
0.02%
1 ene 1979 año
9.51
-0.148
-1.53%
1 ene 1980 año
9.975
+0.464
4.88%
1 ene 1981 año
9.676
-0.298
-2.99%
1 ene 1982 año
8.934
-0.742
-7.67%
1 ene 1983 año
9.564
+0.63
7.05%
1 ene 1984 año
9.441
-0.123
-1.29%
1 ene 1985 año
9.372
-0.069
-0.73%
1 ene 1986 año
9.041
-0.331
-3.53%
1 ene 1987 año
8.928
-0.113
-1.25%
1 ene 1988 año
8.418
-0.51
-5.71%
1 ene 1989 año
9.658
+1.24
14.73%
1 ene 1990 año
9.614
-0.043
-0.45%
1 ene 1991 año
9.758
+0.143
1.49%
1 ene 1992 año
10.448
+0.69
7.07%
1 ene 1993 año
10.215
-0.233
-2.23%
1 ene 1994 año
10.334
+0.119
1.17%
1 ene 1995 año
10.098
-0.236
-2.28%
1 ene 1996 año
10.817
+0.718
7.11%
1 ene 1997 año
11.395
+0.578
5.34%
1 ene 1998 año
11.164
-0.23
-2.02%
1 ene 1999 año
11.751
+0.587
5.26%
1 ene 2000 año
12.295
+0.544
4.63%
1 ene 2001 año
13.153
+0.858
6.98%
1 ene 2002 año
15.249
+2.096
15.93%
1 ene 2003 año
16.794
+1.545
10.13%
1 ene 2004 año
18.585
+1.792
10.67%
1 ene 2005 año
19.579
+0.993
5.34%
1 ene 2006 año
18.815
-0.763
-3.9%
1 ene 2007 año
19.223
+0.407
2.16%
1 ene 2008 año
20.357
+1.135
5.9%
1 ene 2009 año
22.221
+1.864
9.16%
1 ene 2010 año
21.62
-0.601
-2.71%
1 ene 2011 año
22.994
+1.374
6.36%
1 ene 2012 año
22.146
-0.849
-3.69%
1 ene 2013 año
23.694
+1.548
6.99%
1 ene 2014 año
26.342
+2.648
11.18%
Ranking de los países por los datos estadísticos actuales


Comentarios: