29
/es/
es
AIzaSyAYiBZKx7MnpbEhh9jyipgxe19OcubqV5w
April 1, 2024
195427
Mexico
MEX
true
2
1
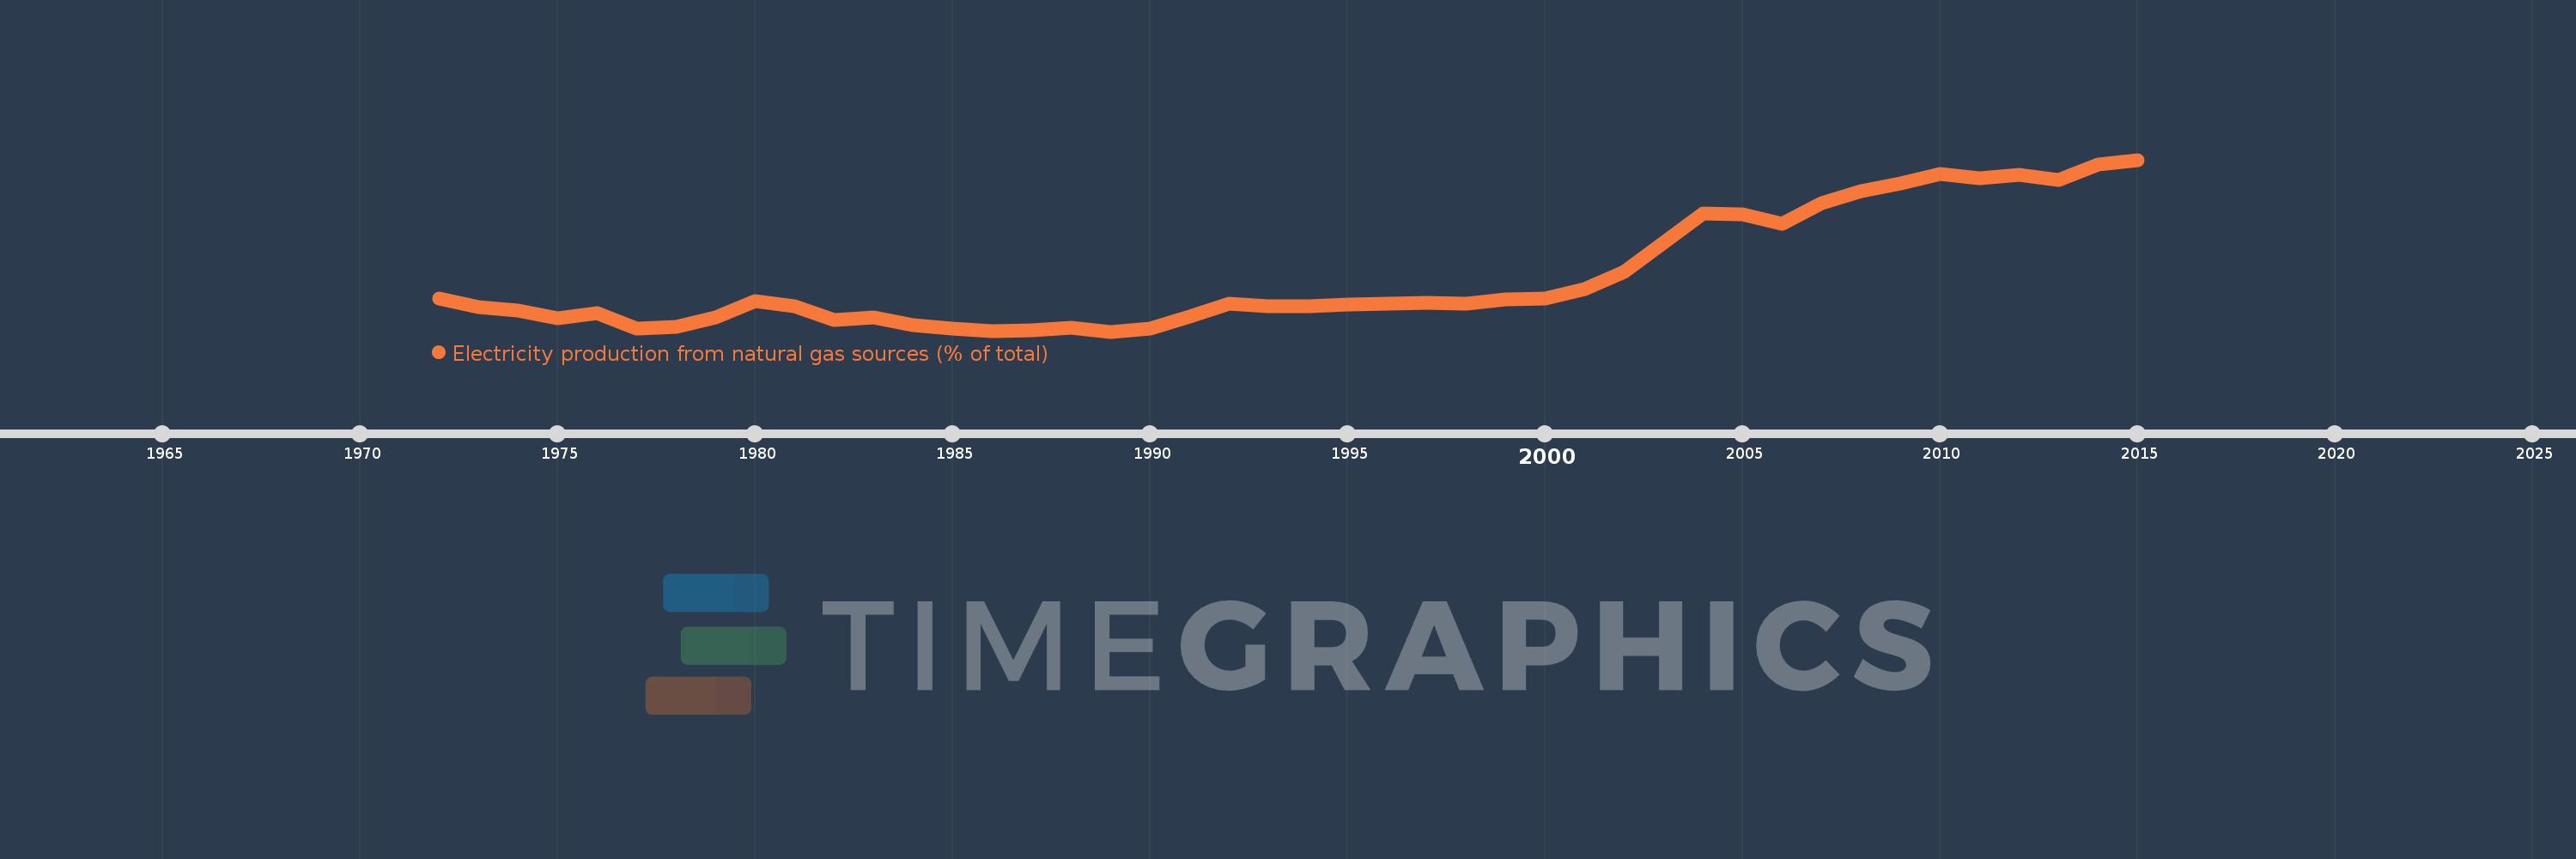
Electricity production from natural gas sources (% of total)
2015,2014,2013,2012,2011,2010,2009,2008,2007,2006,2005,2004,2003,2002,2001,2000,1999,1998,1997,1996,1995,1994,1993,1992,1991,1990,1989,1988,1987,1986,1985,1984,1983,1982,1981,1980,1979,1978,1977,1976,1975,1974,1973,1972
Estas estadísticas en otros países:
AlbaniaAlgeriaAngolaArab WorldArgentinaArmeniaAustraliaAustriaAzerbaijanBahrainBangladeshBelarusBelgiumBeninBoliviaBosnia and HerzegovinaBotswanaBrazilBrunei DarussalamBulgariaCambodiaCameroonCanadaCentral Europe and the BalticsChileChinaColombiaCongo, Dem. Rep.Congo, Rep.Costa RicaCote d'IvoireCroatiaCubaCuracaoCyprusCzech RepublicDenmarkDominican RepublicEarly-demographic dividendEast Asia & PacificEast Asia & Pacific (excluding high income)East Asia & Pacific (IDA & IBRD countries)EcuadorEgypt, Arab Rep.El SalvadorEritreaEstoniaEthiopiaEuro areaEurope & Central AsiaEurope & Central Asia (excluding high income)Europe & Central Asia (IDA & IBRD countries)European UnionFinlandFragile and conflict affected situationsFranceGabonGeorgiaGermanyGhanaGibraltarGreeceGuatemalaHaitiHeavily indebted poor countries (HIPC)High incomeHondurasHong Kong SAR, ChinaHungaryIBRD onlyIcelandIDA & IBRD totalIDA blendIDA onlyIDA totalIndiaIndonesiaIran, Islamic Rep.IraqIrelandIsraelItalyJamaicaJapanJordanKazakhstanKenyaKorea, Dem. People’s Rep.Korea, Rep.KosovoKuwaitKyrgyz RepublicLate-demographic dividendLatin America & Caribbean Latin America & Caribbean (excluding high income)Latin America & the Caribbean (IDA & IBRD countries)LatviaLeast developed countries: UN classificationLebanonLibyaLithuaniaLow & middle incomeLower middle incomeLuxembourgMacedonia, FYRMalaysiaMaltaMauritiusMexicoMiddle East & North AfricaMiddle East & North Africa (excluding high income)Middle East & North Africa (IDA & IBRD countries)Middle incomeMoldovaMongoliaMontenegroMoroccoMozambiqueMyanmarNamibiaNepalNetherlandsNew ZealandNicaraguaNigerNigeriaNorth AmericaNorwayOECD membersOmanOther small statesPakistanPanamaParaguayPeruPhilippinesPolandPortugalPost-demographic dividendPre-demographic dividendQatarRomaniaRussian FederationSaudi ArabiaSenegalSerbiaSingaporeSlovak RepublicSloveniaSmall statesSouth AfricaSouth AsiaSouth Asia (IDA & IBRD)South SudanSpainSri LankaSub-Saharan Africa Sub-Saharan Africa (excluding high income)Sub-Saharan Africa (IDA & IBRD countries)SudanSwedenSwitzerlandSyrian Arab RepublicTajikistanTanzaniaThailandTogoTrinidad and TobagoTunisiaTurkeyTurkmenistanUkraineUnited Arab EmiratesUnited KingdomUnited StatesUpper middle incomeUruguayUzbekistanVenezuela, RBVietnamWorldYemen, Rep.ZambiaZimbabwe línea de tiempo (timeline):
En esta escala de tiempo se presenta un gráfico de 1972 y 2015 de Mexico. Los datos de 1971 están ausentes. El número de observaciones reales por fecha: 44.
Fuente (nombre):
Indicadores del desarrollo mundial
Fuente (organización):
IEA Statistics © OECD/IEA 2014 (http://www.iea.org/stats/index.asp), subject to https://www.iea.org/t&c/termsandconditions/
Categorías:
Energy & Mining, Climate Change, Infrastructure
Se ha actualizado:
23 abr 2017 año
Los indicadores de los cambios de valor en los últimos años
Mínimo:
8.274
1 ene 1989 año
Máximo:
57.202
1 ene 2015 año
A la fecha de observación
Valor
Cambio absoluto
El cambio con respecto al valor anterior
1 ene 1972 año
17.636
+17.636
0.0%
1 ene 1973 año
15.25
-2.386
-13.53%
1 ene 1974 año
14.245
-1.005
-6.59%
1 ene 1975 año
12.005
-2.241
-15.73%
1 ene 1976 año
13.482
+1.478
12.31%
1 ene 1977 año
9.168
-4.314
-32.0%
1 ene 1978 año
9.57
+0.402
4.38%
1 ene 1979 año
12.19
+2.62
27.38%
1 ene 1980 año
17.057
+4.867
39.93%
1 ene 1981 año
15.48
-1.577
-9.24%
1 ene 1982 año
11.523
-3.957
-25.56%
1 ene 1983 año
12.421
+0.898
7.79%
1 ene 1984 año
10.14
-2.282
-18.37%
1 ene 1985 año
9.243
-0.897
-8.84%
1 ene 1986 año
8.491
-0.752
-8.13%
1 ene 1987 año
8.624
+0.133
1.56%
1 ene 1988 año
9.431
+0.806
9.35%
1 ene 1989 año
8.274
-1.157
-12.26%
1 ene 1990 año
9.077
+0.803
9.7%
1 ene 1991 año
12.483
+3.406
37.53%
1 ene 1992 año
16.12
+3.637
29.14%
1 ene 1993 año
15.471
-0.65
-4.03%
1 ene 1994 año
15.386
-0.085
-0.55%
1 ene 1995 año
15.908
+0.523
3.4%
1 ene 1996 año
16.105
+0.197
1.24%
1 ene 1997 año
16.446
+0.341
2.12%
1 ene 1998 año
16.161
-0.285
-1.73%
1 ene 1999 año
17.482
+1.321
8.17%
1 ene 2000 año
17.75
+0.268
1.54%
1 ene 2001 año
20.308
+2.558
14.41%
1 ene 2002 año
25.171
+4.863
23.95%
1 ene 2003 año
33.635
+8.464
33.62%
1 ene 2004 año
41.911
+8.277
24.61%
1 ene 2005 año
41.619
-0.292
-0.7%
1 ene 2006 año
39.011
-2.608
-6.27%
1 ene 2007 año
44.875
+5.864
15.03%
1 ene 2008 año
48.386
+3.511
7.82%
1 ene 2009 año
50.482
+2.095
4.33%
1 ene 2010 año
53.045
+2.563
5.08%
1 ene 2011 año
52.011
-1.034
-1.95%
1 ene 2012 año
52.827
+0.816
1.57%
1 ene 2013 año
51.358
-1.469
-2.78%
1 ene 2014 año
55.794
+4.435
8.64%
1 ene 2015 año
57.202
+1.408
2.52%
Ranking de los países por los datos estadísticos actuales


Comentarios: