29
/es/
es
AIzaSyAYiBZKx7MnpbEhh9jyipgxe19OcubqV5w
April 1, 2024
39707
IDA total
IDA
false
2
1
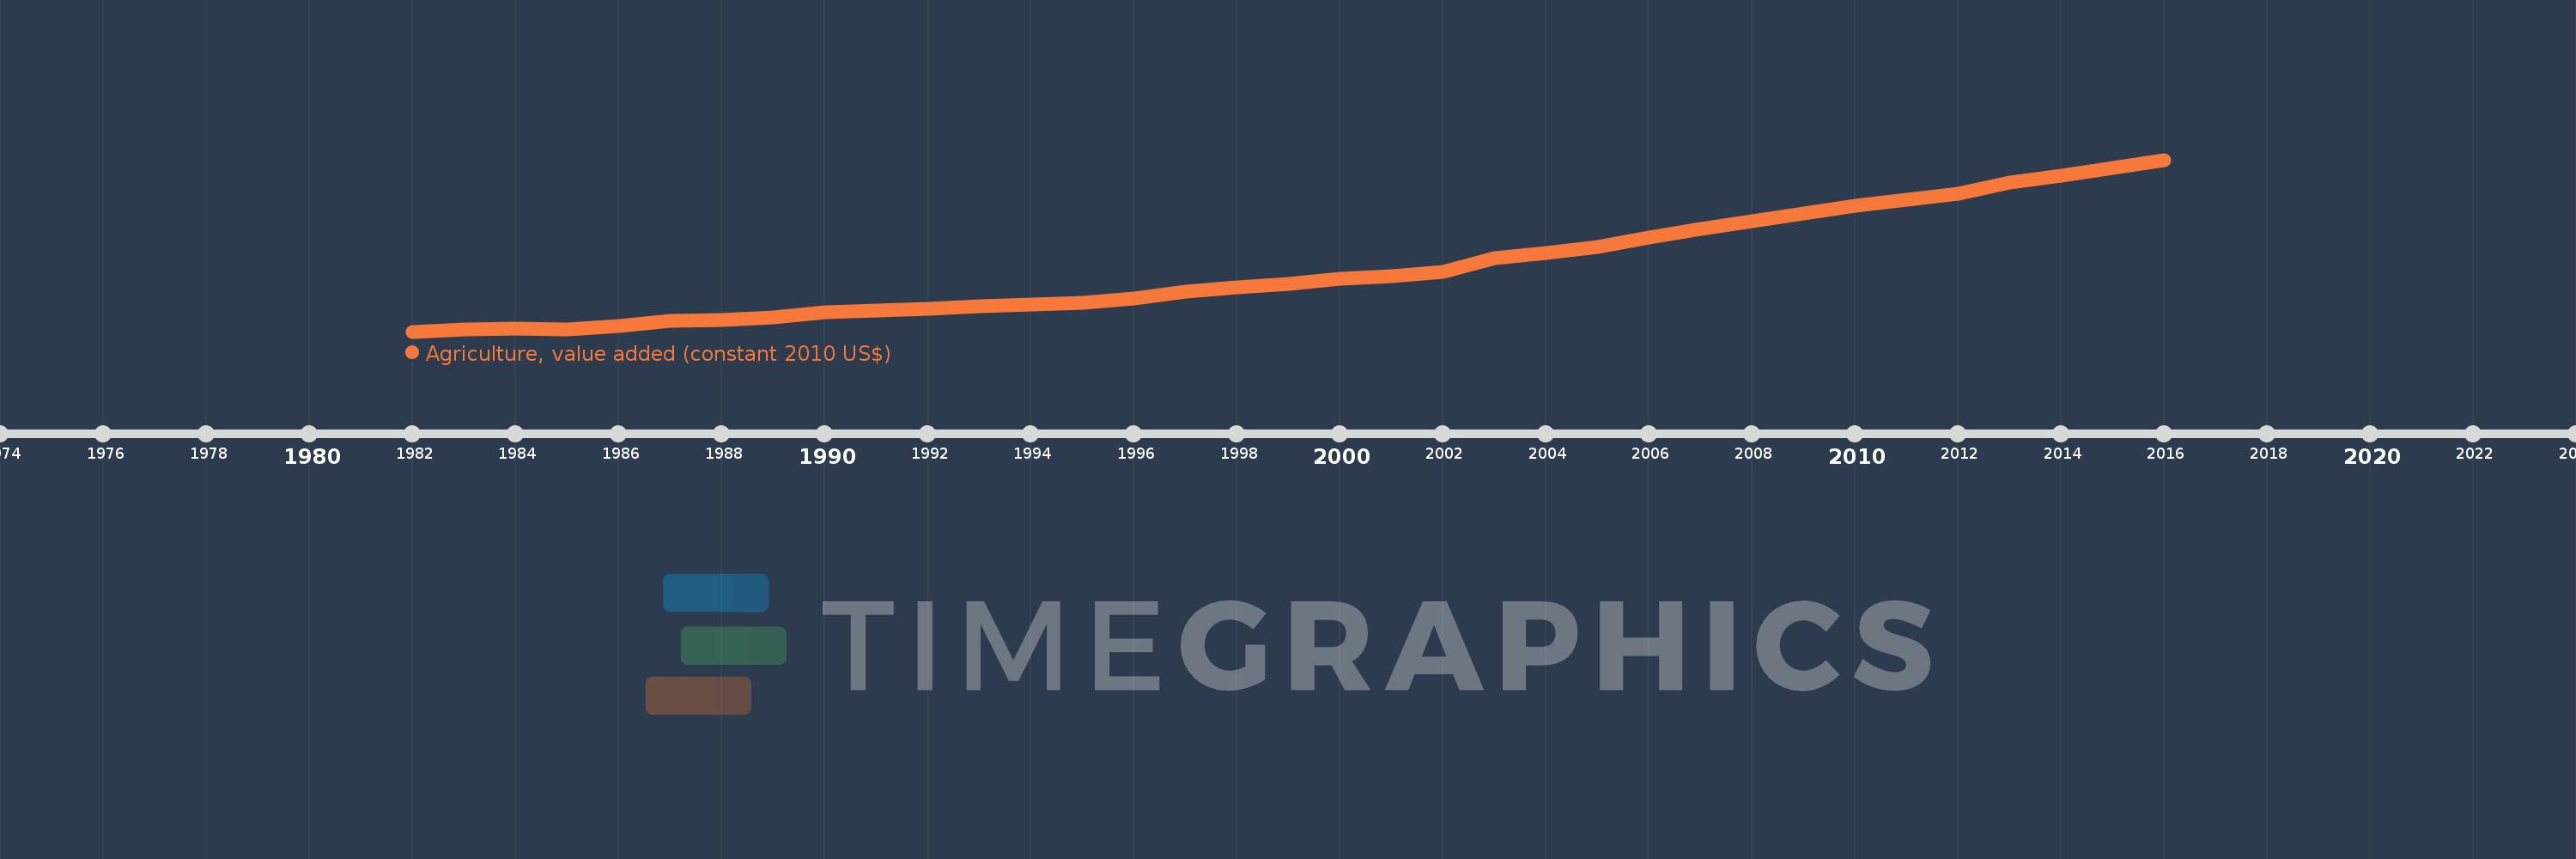
Agriculture, value added (constant 2010 US$)
2016,2015,2014,2013,2012,2011,2010,2009,2008,2007,2006,2005,2004,2003,2002,2001,2000,1999,1998,1997,1996,1995,1994,1993,1992,1991,1990,1989,1988,1987,1986,1985,1984,1983,1982
Estas estadísticas en otros países:
AfghanistanAlbaniaAlgeriaAndorraAntigua and BarbudaArab WorldArgentinaArmeniaArubaAustraliaAustriaAzerbaijanBahamas, TheBahrainBangladeshBarbadosBelarusBelgiumBelizeBeninBermudaBhutanBoliviaBosnia and HerzegovinaBotswanaBrazilBrunei DarussalamBulgariaBurkina FasoBurundiCabo VerdeCambodiaCameroonCanadaCaribbean small statesCentral African RepublicCentral Europe and the BalticsChadChileChinaColombiaComorosCongo, Dem. Rep.Congo, Rep.Costa RicaCote d'IvoireCroatiaCubaCyprusCzech RepublicDenmarkDominicaDominican RepublicEarly-demographic dividendEast Asia & PacificEast Asia & Pacific (excluding high income)East Asia & Pacific (IDA & IBRD countries)EcuadorEgypt, Arab Rep.El SalvadorEquatorial GuineaEstoniaEthiopiaEuro areaEurope & Central AsiaEurope & Central Asia (excluding high income)Europe & Central Asia (IDA & IBRD countries)European UnionFijiFinlandFragile and conflict affected situationsFranceGabonGambia, TheGeorgiaGermanyGhanaGreeceGrenadaGuatemalaGuineaGuinea-BissauGuyanaHeavily indebted poor countries (HIPC)High incomeHondurasHong Kong SAR, ChinaHungaryIBRD onlyIcelandIDA & IBRD totalIDA blendIDA onlyIDA totalIndiaIndonesiaIran, Islamic Rep.IraqIrelandItalyJamaicaJapanJordanKazakhstanKenyaKiribatiKorea, Rep.KosovoKuwaitKyrgyz RepublicLao PDRLate-demographic dividendLatin America & Caribbean Latin America & Caribbean (excluding high income)Latin America & the Caribbean (IDA & IBRD countries)LatviaLeast developed countries: UN classificationLebanonLesothoLiberiaLithuaniaLow & middle incomeLow incomeLower middle incomeLuxembourgMacao SAR, ChinaMacedonia, FYRMadagascarMalawiMalaysiaMaldivesMaliMaltaMarshall IslandsMauritaniaMauritiusMexicoMicronesia, Fed. Sts.Middle East & North AfricaMiddle East & North Africa (excluding high income)Middle East & North Africa (IDA & IBRD countries)Middle incomeMoldovaMongoliaMontenegroMoroccoMozambiqueMyanmarNamibiaNepalNetherlandsNew ZealandNicaraguaNigerNigeriaNorth AmericaNorwayOECD membersOmanOther small statesPakistanPalauPanamaParaguayPeruPhilippinesPolandPortugalPost-demographic dividendPre-demographic dividendPuerto RicoQatarRomaniaRussian FederationRwandaSamoaSao Tome and PrincipeSaudi ArabiaSenegalSerbiaSeychellesSierra LeoneSingaporeSlovak RepublicSloveniaSmall statesSouth AfricaSouth AsiaSouth Asia (IDA & IBRD)SpainSri LankaSt. Kitts and NevisSt. LuciaSt. Vincent and the GrenadinesSub-Saharan Africa Sub-Saharan Africa (excluding high income)Sub-Saharan Africa (IDA & IBRD countries)SudanSurinameSwazilandSwedenSwitzerlandTajikistanTanzaniaThailandTimor-LesteTogoTongaTrinidad and TobagoTunisiaTurkeyTurkmenistanTuvaluUgandaUkraineUnited Arab EmiratesUnited KingdomUnited StatesUpper middle incomeUruguayUzbekistanVanuatuVenezuela, RBVietnamWest Bank and GazaWorldYemen, Rep.ZambiaZimbabwe línea de tiempo (timeline):
En esta escala de tiempo se presenta un gráfico de 1982 y 2016 de IDA total. Los datos de 1981 están ausentes. El número de observaciones reales por fecha: 35.
Fuente (nombre):
Indicadores del desarrollo mundial
Fuente (organización):
World Bank national accounts data, and OECD National Accounts data files.
Categorías:
Economy & Growth
Se ha actualizado:
23 abr 2017 año
Los indicadores de los cambios de valor en los últimos años
Mínimo:
126.853 bn
1 ene 1982 año
Máximo:
436.396 bn
1 ene 2016 año
A la fecha de observación
Valor
Cambio absoluto
El cambio con respecto al valor anterior
1 ene 1982 año
126.853 bn
+126.853 bn
0.0%
1 ene 1983 año
131.369 bn
+4.516 bn
3.56%
1 ene 1984 año
132.395 bn
+1.026 bn
0.78%
1 ene 1985 año
130.562 bn
-1.833 bn
-1.38%
1 ene 1986 año
137.459 bn
+6.897 bn
5.28%
1 ene 1987 año
145.705 bn
+8.246 bn
6.0%
1 ene 1988 año
147.761 bn
+2.056 bn
1.41%
1 ene 1989 año
152.535 bn
+4.774 bn
3.23%
1 ene 1990 año
161.057 bn
+8.522 bn
5.59%
1 ene 1991 año
164.011 bn
+2.954 bn
1.83%
1 ene 1992 año
168.544 bn
+4.533 bn
2.76%
1 ene 1993 año
172.26 bn
+3.716 bn
2.2%
1 ene 1994 año
176.184 bn
+3.924 bn
2.28%
1 ene 1995 año
178.7 bn
+2.516 bn
1.43%
1 ene 1996 año
187.158 bn
+8.458 bn
4.73%
1 ene 1997 año
199.333 bn
+12.176 bn
6.51%
1 ene 1998 año
206.358 bn
+7.024 bn
3.52%
1 ene 1999 año
213.07 bn
+6.712 bn
3.25%
1 ene 2000 año
221.585 bn
+8.515 bn
4.0%
1 ene 2001 año
227.052 bn
+5.467 bn
2.47%
1 ene 2002 año
234.438 bn
+7.386 bn
3.25%
1 ene 2003 año
258.574 bn
+24.135 bn
10.3%
1 ene 2004 año
268.721 bn
+10.147 bn
3.92%
1 ene 2005 año
279.6 bn
+10.879 bn
4.05%
1 ene 2006 año
296.073 bn
+16.473 bn
5.89%
1 ene 2007 año
311.468 bn
+15.395 bn
5.2%
1 ene 2008 año
326.008 bn
+14.54 bn
4.67%
1 ene 2009 año
340.009 bn
+14.001 bn
4.29%
1 ene 2010 año
352.937 bn
+12.928 bn
3.8%
1 ene 2011 año
364.891 bn
+11.953 bn
3.39%
1 ene 2012 año
375.311 bn
+10.421 bn
2.86%
1 ene 2013 año
395.047 bn
+19.735 bn
5.26%
1 ene 2014 año
407.3 bn
+12.253 bn
3.1%
1 ene 2015 año
422.393 bn
+15.094 bn
3.71%
1 ene 2016 año
436.396 bn
+14.003 bn
3.32%
Ranking de los países por los datos estadísticos actuales


Comentarios: