29
/es/
es
AIzaSyAYiBZKx7MnpbEhh9jyipgxe19OcubqV5w
April 1, 2024
26295
Early-demographic dividend
EAR
false
2
1
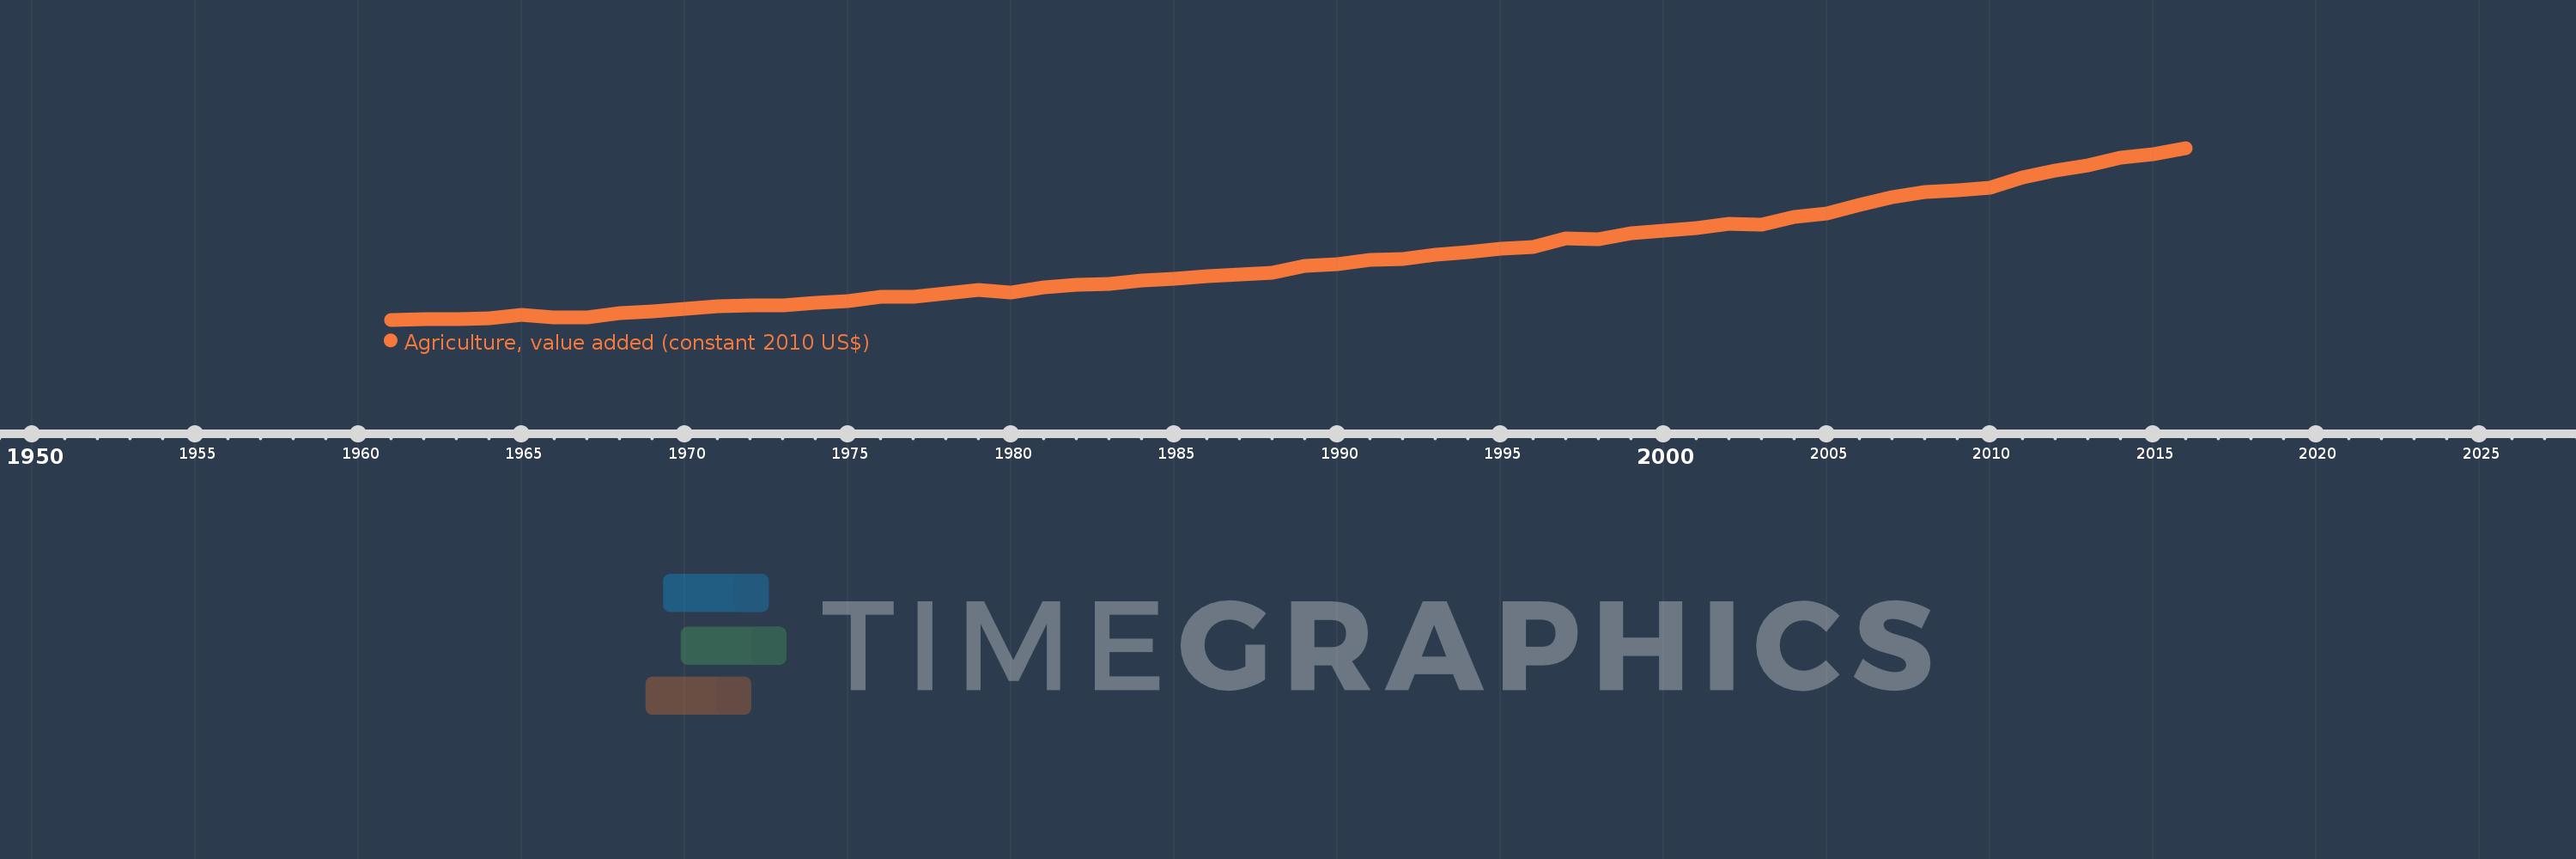
Agriculture, value added (constant 2010 US$)
2016,2015,2014,2013,2012,2011,2010,2009,2008,2007,2006,2005,2004,2003,2002,2001,2000,1999,1998,1997,1996,1995,1994,1993,1992,1991,1990,1989,1988,1987,1986,1985,1984,1983,1982,1981,1980,1979,1978,1977,1976,1975,1974,1973,1972,1971,1970,1969,1968,1967,1966,1965,1964,1963,1962,1961
Estas estadísticas en otros países:
AfghanistanAlbaniaAlgeriaAndorraAntigua and BarbudaArab WorldArgentinaArmeniaArubaAustraliaAustriaAzerbaijanBahamas, TheBahrainBangladeshBarbadosBelarusBelgiumBelizeBeninBermudaBhutanBoliviaBosnia and HerzegovinaBotswanaBrazilBrunei DarussalamBulgariaBurkina FasoBurundiCabo VerdeCambodiaCameroonCanadaCaribbean small statesCentral African RepublicCentral Europe and the BalticsChadChileChinaColombiaComorosCongo, Dem. Rep.Congo, Rep.Costa RicaCote d'IvoireCroatiaCubaCyprusCzech RepublicDenmarkDominicaDominican RepublicEarly-demographic dividendEast Asia & PacificEast Asia & Pacific (excluding high income)East Asia & Pacific (IDA & IBRD countries)EcuadorEgypt, Arab Rep.El SalvadorEquatorial GuineaEstoniaEthiopiaEuro areaEurope & Central AsiaEurope & Central Asia (excluding high income)Europe & Central Asia (IDA & IBRD countries)European UnionFijiFinlandFragile and conflict affected situationsFranceGabonGambia, TheGeorgiaGermanyGhanaGreeceGrenadaGuatemalaGuineaGuinea-BissauGuyanaHeavily indebted poor countries (HIPC)High incomeHondurasHong Kong SAR, ChinaHungaryIBRD onlyIcelandIDA & IBRD totalIDA blendIDA onlyIDA totalIndiaIndonesiaIran, Islamic Rep.IraqIrelandItalyJamaicaJapanJordanKazakhstanKenyaKiribatiKorea, Rep.KosovoKuwaitKyrgyz RepublicLao PDRLate-demographic dividendLatin America & Caribbean Latin America & Caribbean (excluding high income)Latin America & the Caribbean (IDA & IBRD countries)LatviaLeast developed countries: UN classificationLebanonLesothoLiberiaLithuaniaLow & middle incomeLow incomeLower middle incomeLuxembourgMacao SAR, ChinaMacedonia, FYRMadagascarMalawiMalaysiaMaldivesMaliMaltaMarshall IslandsMauritaniaMauritiusMexicoMicronesia, Fed. Sts.Middle East & North AfricaMiddle East & North Africa (excluding high income)Middle East & North Africa (IDA & IBRD countries)Middle incomeMoldovaMongoliaMontenegroMoroccoMozambiqueMyanmarNamibiaNepalNetherlandsNew ZealandNicaraguaNigerNigeriaNorth AmericaNorwayOECD membersOmanOther small statesPakistanPalauPanamaParaguayPeruPhilippinesPolandPortugalPost-demographic dividendPre-demographic dividendPuerto RicoQatarRomaniaRussian FederationRwandaSamoaSao Tome and PrincipeSaudi ArabiaSenegalSerbiaSeychellesSierra LeoneSingaporeSlovak RepublicSloveniaSmall statesSouth AfricaSouth AsiaSouth Asia (IDA & IBRD)SpainSri LankaSt. Kitts and NevisSt. LuciaSt. Vincent and the GrenadinesSub-Saharan Africa Sub-Saharan Africa (excluding high income)Sub-Saharan Africa (IDA & IBRD countries)SudanSurinameSwazilandSwedenSwitzerlandTajikistanTanzaniaThailandTimor-LesteTogoTongaTrinidad and TobagoTunisiaTurkeyTurkmenistanTuvaluUgandaUkraineUnited Arab EmiratesUnited KingdomUnited StatesUpper middle incomeUruguayUzbekistanVanuatuVenezuela, RBVietnamWest Bank and GazaWorldYemen, Rep.ZambiaZimbabwe línea de tiempo (timeline):
En esta escala de tiempo se presenta un gráfico de 1961 y 2016 de Early-demographic dividend. Los datos de 1960 están ausentes. El número de observaciones reales por fecha: 56.
Fuente (nombre):
Indicadores del desarrollo mundial
Fuente (organización):
World Bank national accounts data, and OECD National Accounts data files.
Categorías:
Economy & Growth
Se ha actualizado:
23 abr 2017 año
Los indicadores de los cambios de valor en los últimos años
Mínimo:
234.544 bn
1 ene 1961 año
Máximo:
990.658 bn
1 ene 2016 año
A la fecha de observación
Valor
Cambio absoluto
El cambio con respecto al valor anterior
1 ene 1961 año
234.544 bn
+234.544 bn
0.0%
1 ene 1962 año
236.423 bn
+1.879 bn
0.8%
1 ene 1963 año
236.861 bn
+438.658 millones
0.19%
1 ene 1964 año
240.898 bn
+4.037 bn
1.7%
1 ene 1965 año
256.65 bn
+15.751 bn
6.54%
1 ene 1966 año
244.365 bn
-12.285 bn
-4.79%
1 ene 1967 año
245.963 bn
+1.598 bn
0.65%
1 ene 1968 año
265.053 bn
+19.09 bn
7.76%
1 ene 1969 año
271.998 bn
+6.946 bn
2.62%
1 ene 1970 año
282.268 bn
+10.27 bn
3.78%
1 ene 1971 año
294.894 bn
+12.626 bn
4.47%
1 ene 1972 año
299.531 bn
+4.637 bn
1.57%
1 ene 1973 año
297.519 bn
-2.012 bn
-0.67%
1 ene 1974 año
308.938 bn
+11.42 bn
3.84%
1 ene 1975 año
316.741 bn
+7.803 bn
2.53%
1 ene 1976 año
334.371 bn
+17.63 bn
5.57%
1 ene 1977 año
336.953 bn
+2.582 bn
0.77%
1 ene 1978 año
352.441 bn
+15.488 bn
4.6%
1 ene 1979 año
364.304 bn
+11.863 bn
3.37%
1 ene 1980 año
353.013 bn
-11.291 bn
-3.1%
1 ene 1981 año
375.946 bn
+22.933 bn
6.5%
1 ene 1982 año
388.336 bn
+12.39 bn
3.3%
1 ene 1983 año
392.35 bn
+4.015 bn
1.03%
1 ene 1984 año
406.459 bn
+14.109 bn
3.6%
1 ene 1985 año
416.32 bn
+9.86 bn
2.43%
1 ene 1986 año
426.274 bn
+9.954 bn
2.39%
1 ene 1987 año
435.024 bn
+8.75 bn
2.05%
1 ene 1988 año
440.006 bn
+4.982 bn
1.15%
1 ene 1989 año
473.36 bn
+33.354 bn
7.58%
1 ene 1990 año
479.298 bn
+5.938 bn
1.25%
1 ene 1991 año
498.069 bn
+18.771 bn
3.92%
1 ene 1992 año
501.801 bn
+3.732 bn
0.75%
1 ene 1993 año
522.589 bn
+20.788 bn
4.14%
1 ene 1994 año
533.758 bn
+11.169 bn
2.14%
1 ene 1995 año
548.582 bn
+14.825 bn
2.78%
1 ene 1996 año
556.346 bn
+7.763 bn
1.42%
1 ene 1997 año
592.764 bn
+36.419 bn
6.55%
1 ene 1998 año
589.681 bn
-3.083 bn
-0.52%
1 ene 1999 año
613.728 bn
+24.047 bn
4.08%
1 ene 2000 año
624.9 bn
+11.171 bn
1.82%
1 ene 2001 año
638.771 bn
+13.871 bn
2.22%
1 ene 2002 año
656.104 bn
+17.333 bn
2.71%
1 ene 2003 año
654.114 bn
-1.99 bn
-0.3%
1 ene 2004 año
687.628 bn
+33.515 bn
5.12%
1 ene 2005 año
702.143 bn
+14.515 bn
2.11%
1 ene 2006 año
739.014 bn
+36.871 bn
5.25%
1 ene 2007 año
775.457 bn
+36.442 bn
4.93%
1 ene 2008 año
795.897 bn
+20.44 bn
2.64%
1 ene 2009 año
803.832 bn
+7.935 bn
1.0%
1 ene 2010 año
815.239 bn
+11.407 bn
1.42%
1 ene 2011 año
860.417 bn
+45.178 bn
5.54%
1 ene 2012 año
891.878 bn
+31.461 bn
3.66%
1 ene 2013 año
912.247 bn
+20.369 bn
2.28%
1 ene 2014 año
948.693 bn
+36.446 bn
4.0%
1 ene 2015 año
964.191 bn
+15.498 bn
1.63%
1 ene 2016 año
990.658 bn
+26.467 bn
2.74%
Ranking de los países por los datos estadísticos actuales


Comentarios: