29
/es/
es
AIzaSyAYiBZKx7MnpbEhh9jyipgxe19OcubqV5w
April 1, 2024
36417
IBRD only
IBD
false
2
1
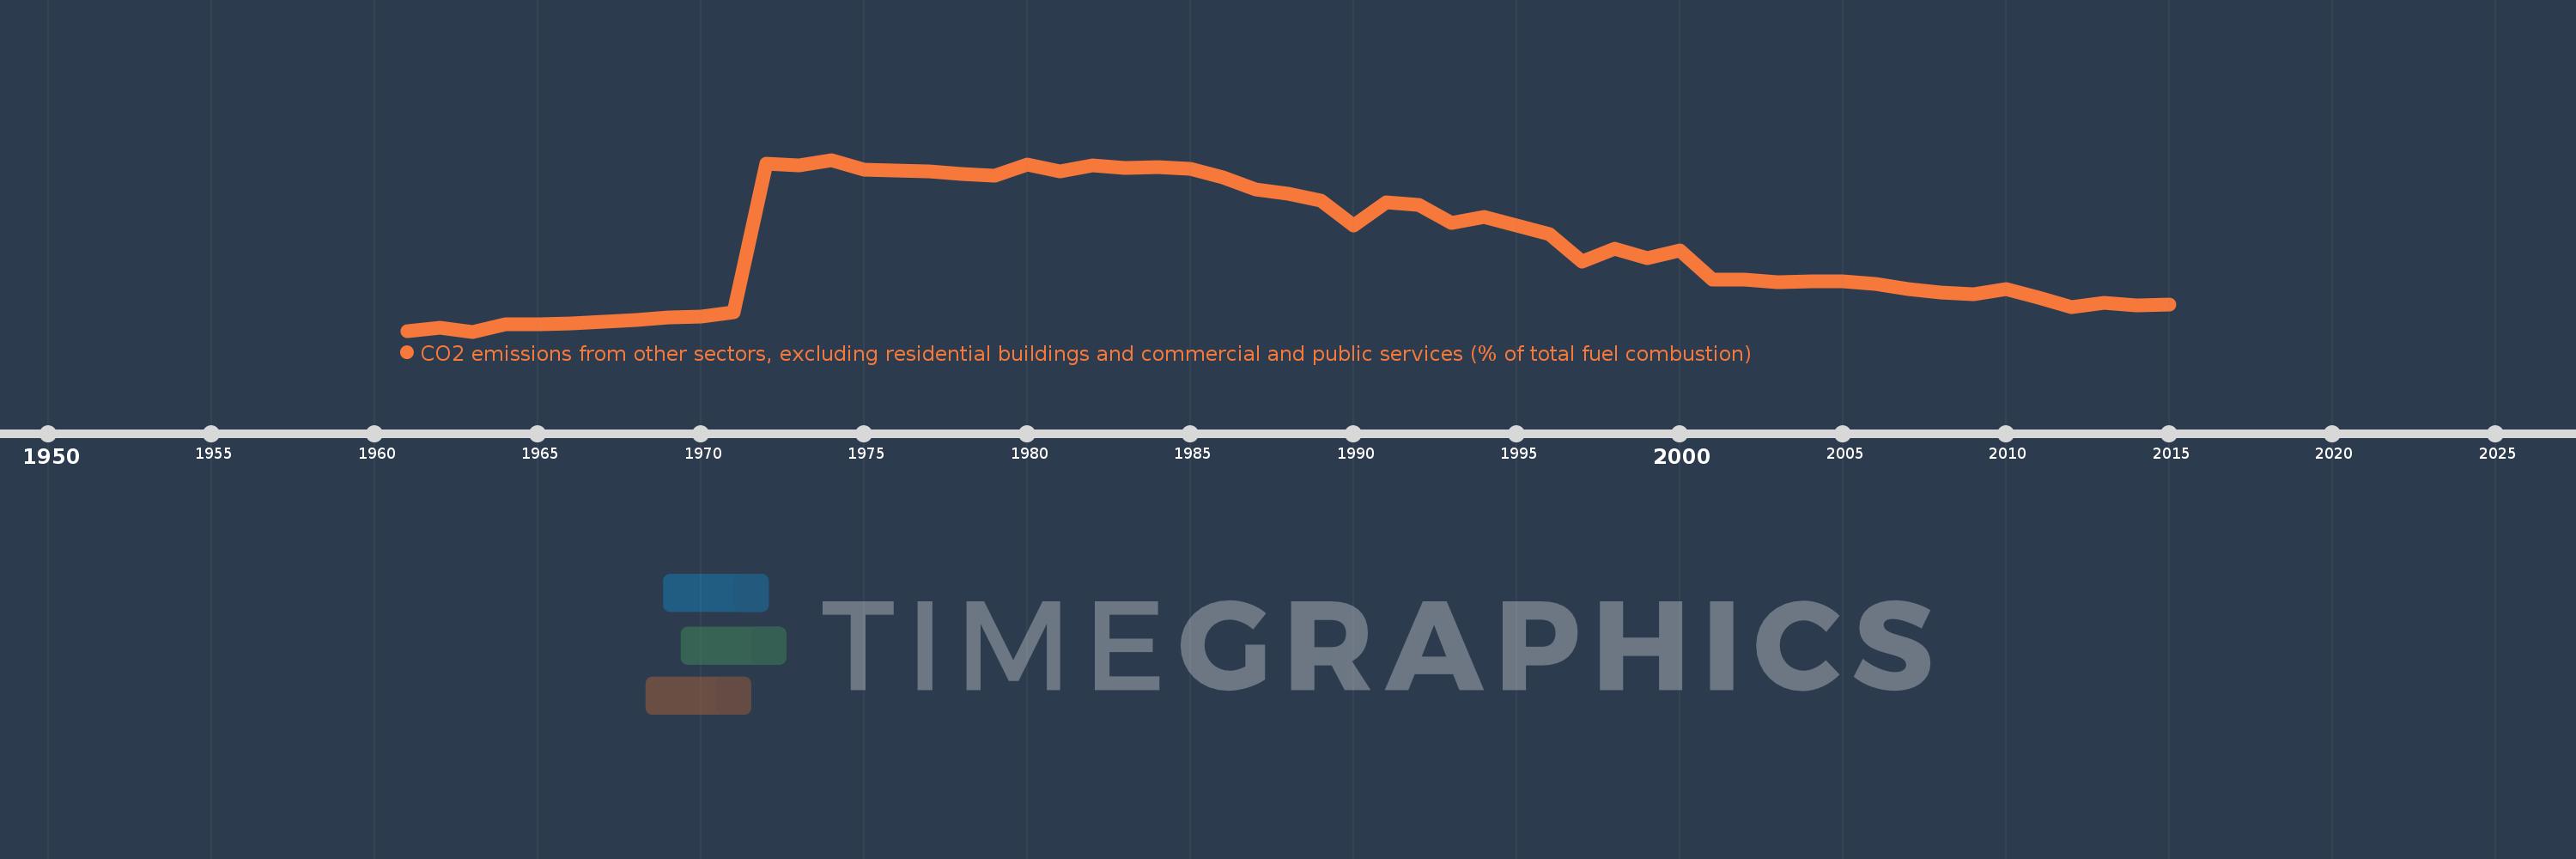
CO2 emissions from other sectors, excluding residential buildings and commercial and public services (% of total fuel combustion)
2015,2014,2013,2012,2011,2010,2009,2008,2007,2006,2005,2004,2003,2002,2001,2000,1999,1998,1997,1996,1995,1994,1993,1992,1991,1990,1989,1988,1987,1986,1985,1984,1983,1982,1981,1980,1979,1978,1977,1976,1975,1974,1973,1972,1971,1970,1969,1968,1967,1966,1965,1964,1963,1962,1961
Estas estadísticas en otros países:
AlbaniaAlgeriaAngolaArab WorldArgentinaArmeniaAustraliaAustriaAzerbaijanBahrainBangladeshBelarusBelgiumBeninBoliviaBosnia and HerzegovinaBotswanaBrazilBrunei DarussalamBulgariaCambodiaCameroonCanadaCaribbean small statesCentral Europe and the BalticsChileChinaColombiaCongo, Dem. Rep.Congo, Rep.Costa RicaCote d'IvoireCroatiaCubaCuracaoCyprusCzech RepublicDenmarkDominican RepublicEarly-demographic dividendEast Asia & PacificEast Asia & Pacific (excluding high income)East Asia & Pacific (IDA & IBRD countries)EcuadorEgypt, Arab Rep.El SalvadorEritreaEstoniaEthiopiaEuro areaEurope & Central AsiaEurope & Central Asia (excluding high income)Europe & Central Asia (IDA & IBRD countries)European UnionFinlandFragile and conflict affected situationsFranceGabonGeorgiaGermanyGhanaGibraltarGreeceGuatemalaHaitiHeavily indebted poor countries (HIPC)High incomeHondurasHong Kong SAR, ChinaHungaryIBRD onlyIcelandIDA & IBRD totalIDA blendIDA onlyIDA totalIndiaIndonesiaIran, Islamic Rep.IraqIrelandIsraelItalyJamaicaJapanJordanKazakhstanKenyaKorea, Dem. People’s Rep.Korea, Rep.KosovoKuwaitKyrgyz RepublicLate-demographic dividendLatin America & Caribbean Latin America & Caribbean (excluding high income)Latin America & the Caribbean (IDA & IBRD countries)LatviaLeast developed countries: UN classificationLebanonLibyaLithuaniaLow & middle incomeLow incomeLower middle incomeLuxembourgMacedonia, FYRMalaysiaMaltaMauritiusMexicoMiddle East & North AfricaMiddle East & North Africa (excluding high income)Middle East & North Africa (IDA & IBRD countries)Middle incomeMoldovaMongoliaMontenegroMoroccoMozambiqueMyanmarNamibiaNepalNetherlandsNew ZealandNicaraguaNigerNigeriaNorth AmericaNorwayOECD membersOmanOther small statesPakistanPanamaParaguayPeruPhilippinesPolandPortugalPost-demographic dividendPre-demographic dividendQatarRomaniaRussian FederationSaudi ArabiaSenegalSerbiaSingaporeSlovak RepublicSloveniaSmall statesSouth AfricaSouth AsiaSouth Asia (IDA & IBRD)South SudanSpainSri LankaSub-Saharan Africa Sub-Saharan Africa (excluding high income)Sub-Saharan Africa (IDA & IBRD countries)SudanSwedenSwitzerlandSyrian Arab RepublicTajikistanTanzaniaThailandTogoTrinidad and TobagoTunisiaTurkeyTurkmenistanUkraineUnited Arab EmiratesUnited KingdomUnited StatesUpper middle incomeUruguayUzbekistanVenezuela, RBVietnamWorldYemen, Rep.ZambiaZimbabwe línea de tiempo (timeline):
En esta escala de tiempo se presenta un gráfico de 1961 y 2015 de IBRD only. Los datos de 1960 están ausentes. El número de observaciones reales por fecha: 55.
Fuente (nombre):
Indicadores del desarrollo mundial
Fuente (organización):
IEA Statistics © OECD/IEA 2014 (http://www.iea.org/stats/index.asp), subject to https://www.iea.org/t&c/termsandconditions/
Categorías:
Environment
Se ha actualizado:
23 abr 2017 año
Los indicadores de los cambios de valor en los últimos años
Mínimo:
1.655
1 ene 1963 año
Máximo:
5.915
1 ene 1974 año
A la fecha de observación
Valor
Cambio absoluto
El cambio con respecto al valor anterior
1 ene 1961 año
1.666
+1.666
0.0%
1 ene 1962 año
1.759
+0.092
5.53%
1 ene 1963 año
1.655
-0.104
-5.9%
1 ene 1964 año
1.831
+0.176
10.66%
1 ene 1965 año
1.829
-0.003
-0.14%
1 ene 1966 año
1.86
+0.032
1.73%
1 ene 1967 año
1.89
+0.03
1.61%
1 ene 1968 año
1.943
+0.053
2.78%
1 ene 1969 año
1.996
+0.054
2.76%
1 ene 1970 año
2.034
+0.038
1.88%
1 ene 1971 año
2.134
+0.1
4.9%
1 ene 1972 año
5.809
+3.675
172.25%
1 ene 1973 año
5.78
-0.029
-0.5%
1 ene 1974 año
5.915
+0.135
2.34%
1 ene 1975 año
5.678
-0.237
-4.0%
1 ene 1976 año
5.655
-0.023
-0.41%
1 ene 1977 año
5.619
-0.036
-0.63%
1 ene 1978 año
5.554
-0.065
-1.16%
1 ene 1979 año
5.514
-0.04
-0.72%
1 ene 1980 año
5.794
+0.28
5.07%
1 ene 1981 año
5.621
-0.172
-2.98%
1 ene 1982 año
5.785
+0.164
2.92%
1 ene 1983 año
5.718
-0.068
-1.17%
1 ene 1984 año
5.739
+0.021
0.36%
1 ene 1985 año
5.685
-0.054
-0.94%
1 ene 1986 año
5.485
-0.2
-3.53%
1 ene 1987 año
5.186
-0.299
-5.45%
1 ene 1988 año
5.076
-0.11
-2.12%
1 ene 1989 año
4.908
-0.168
-3.3%
1 ene 1990 año
4.278
-0.63
-12.84%
1 ene 1991 año
4.859
+0.581
13.58%
1 ene 1992 año
4.805
-0.054
-1.1%
1 ene 1993 año
4.339
-0.467
-9.71%
1 ene 1994 año
4.494
+0.155
3.58%
1 ene 1995 año
4.279
-0.215
-4.78%
1 ene 1996 año
4.083
-0.196
-4.58%
1 ene 1997 año
3.387
-0.696
-17.05%
1 ene 1998 año
3.721
+0.334
9.87%
1 ene 1999 año
3.481
-0.24
-6.46%
1 ene 2000 año
3.674
+0.193
5.55%
1 ene 2001 año
2.948
-0.726
-19.76%
1 ene 2002 año
2.95
+0.002
0.06%
1 ene 2003 año
2.885
-0.064
-2.18%
1 ene 2004 año
2.891
+0.006
0.21%
1 ene 2005 año
2.908
+0.017
0.57%
1 ene 2006 año
2.846
-0.062
-2.15%
1 ene 2007 año
2.707
-0.139
-4.89%
1 ene 2008 año
2.62
-0.087
-3.21%
1 ene 2009 año
2.587
-0.033
-1.25%
1 ene 2010 año
2.719
+0.132
5.09%
1 ene 2011 año
2.504
-0.215
-7.9%
1 ene 2012 año
2.267
-0.237
-9.45%
1 ene 2013 año
2.37
+0.102
4.52%
1 ene 2014 año
2.31
-0.06
-2.52%
1 ene 2015 año
2.322
+0.011
0.49%
Ranking de los países por los datos estadísticos actuales


Comentarios: