29
/es/
es
AIzaSyAYiBZKx7MnpbEhh9jyipgxe19OcubqV5w
April 1, 2024
163584
Japan
JPN
true
2
1
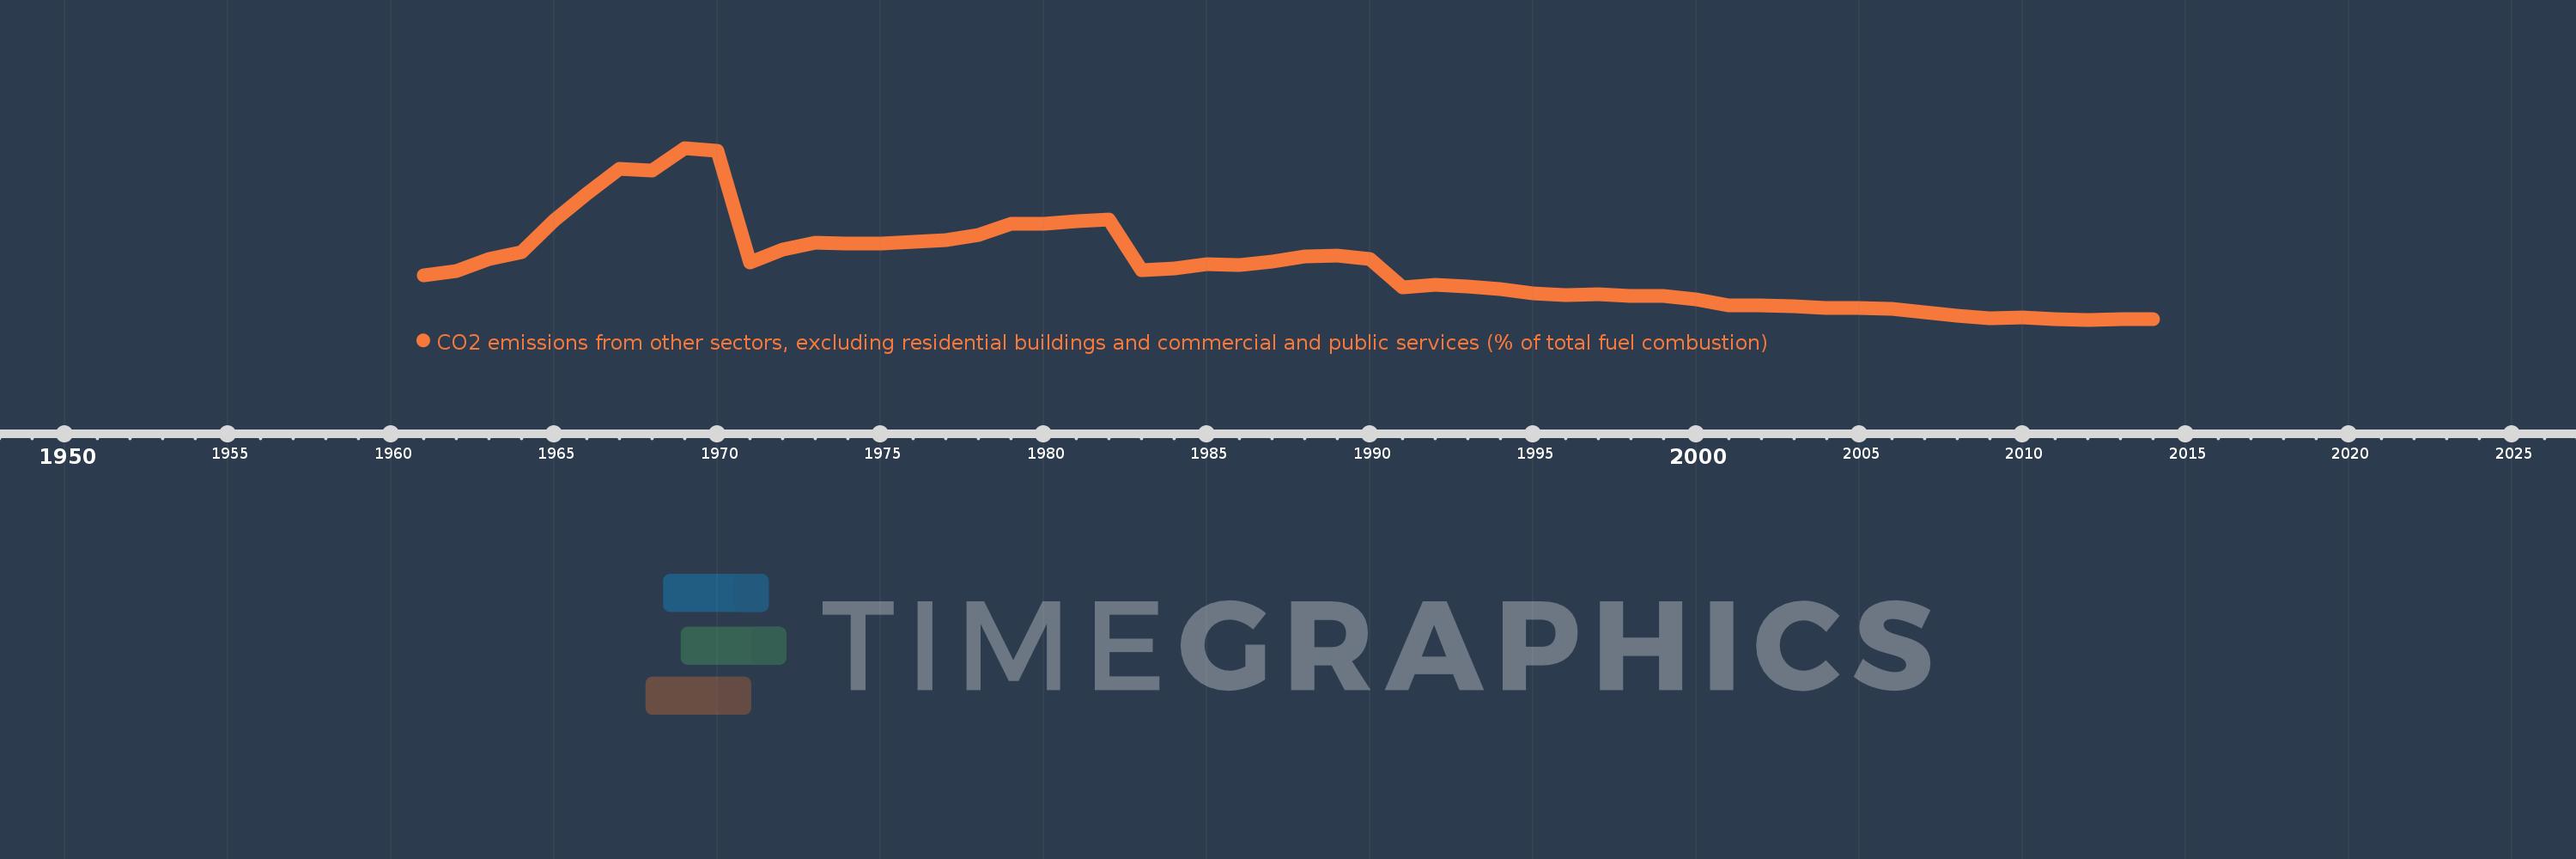
CO2 emissions from other sectors, excluding residential buildings and commercial and public services (% of total fuel combustion)
2014,2013,2012,2011,2010,2009,2008,2007,2006,2005,2004,2003,2002,2001,2000,1999,1998,1997,1996,1995,1994,1993,1992,1991,1990,1989,1988,1987,1986,1985,1984,1983,1982,1981,1980,1979,1978,1977,1976,1975,1974,1973,1972,1971,1970,1969,1968,1967,1966,1965,1964,1963,1962,1961
Estas estadísticas en otros países:
AlbaniaAlgeriaAngolaArab WorldArgentinaArmeniaAustraliaAustriaAzerbaijanBahrainBangladeshBelarusBelgiumBeninBoliviaBosnia and HerzegovinaBotswanaBrazilBrunei DarussalamBulgariaCambodiaCameroonCanadaCaribbean small statesCentral Europe and the BalticsChileChinaColombiaCongo, Dem. Rep.Congo, Rep.Costa RicaCote d'IvoireCroatiaCubaCuracaoCyprusCzech RepublicDenmarkDominican RepublicEarly-demographic dividendEast Asia & PacificEast Asia & Pacific (excluding high income)East Asia & Pacific (IDA & IBRD countries)EcuadorEgypt, Arab Rep.El SalvadorEritreaEstoniaEthiopiaEuro areaEurope & Central AsiaEurope & Central Asia (excluding high income)Europe & Central Asia (IDA & IBRD countries)European UnionFinlandFragile and conflict affected situationsFranceGabonGeorgiaGermanyGhanaGibraltarGreeceGuatemalaHaitiHeavily indebted poor countries (HIPC)High incomeHondurasHong Kong SAR, ChinaHungaryIBRD onlyIcelandIDA & IBRD totalIDA blendIDA onlyIDA totalIndiaIndonesiaIran, Islamic Rep.IraqIrelandIsraelItalyJamaicaJapanJordanKazakhstanKenyaKorea, Dem. People’s Rep.Korea, Rep.KosovoKuwaitKyrgyz RepublicLate-demographic dividendLatin America & Caribbean Latin America & Caribbean (excluding high income)Latin America & the Caribbean (IDA & IBRD countries)LatviaLeast developed countries: UN classificationLebanonLibyaLithuaniaLow & middle incomeLow incomeLower middle incomeLuxembourgMacedonia, FYRMalaysiaMaltaMauritiusMexicoMiddle East & North AfricaMiddle East & North Africa (excluding high income)Middle East & North Africa (IDA & IBRD countries)Middle incomeMoldovaMongoliaMontenegroMoroccoMozambiqueMyanmarNamibiaNepalNetherlandsNew ZealandNicaraguaNigerNigeriaNorth AmericaNorwayOECD membersOmanOther small statesPakistanPanamaParaguayPeruPhilippinesPolandPortugalPost-demographic dividendPre-demographic dividendQatarRomaniaRussian FederationSaudi ArabiaSenegalSerbiaSingaporeSlovak RepublicSloveniaSmall statesSouth AfricaSouth AsiaSouth Asia (IDA & IBRD)South SudanSpainSri LankaSub-Saharan Africa Sub-Saharan Africa (excluding high income)Sub-Saharan Africa (IDA & IBRD countries)SudanSwedenSwitzerlandSyrian Arab RepublicTajikistanTanzaniaThailandTogoTrinidad and TobagoTunisiaTurkeyTurkmenistanUkraineUnited Arab EmiratesUnited KingdomUnited StatesUpper middle incomeUruguayUzbekistanVenezuela, RBVietnamWorldYemen, Rep.ZambiaZimbabwe línea de tiempo (timeline):
En esta escala de tiempo se presenta un gráfico de 1961 y 2014 de Japan. Los datos de 1960 están ausentes. El número de observaciones reales por fecha: 54.
Fuente (nombre):
Indicadores del desarrollo mundial
Fuente (organización):
IEA Statistics © OECD/IEA 2014 (http://www.iea.org/stats/index.asp), subject to https://www.iea.org/t&c/termsandconditions/
Categorías:
Environment
Se ha actualizado:
23 abr 2017 año
Los indicadores de los cambios de valor en los últimos años
Mínimo:
0.878
1 ene 2012 año
Máximo:
6.823
1 ene 1969 año
A la fecha de observación
Valor
Cambio absoluto
El cambio con respecto al valor anterior
1 ene 1961 año
2.421
+2.421
0.0%
1 ene 1962 año
2.562
+0.141
5.82%
1 ene 1963 año
2.98
+0.418
16.32%
1 ene 1964 año
3.228
+0.248
8.33%
1 ene 1965 año
4.32
+1.092
33.82%
1 ene 1966 año
5.246
+0.926
21.44%
1 ene 1967 año
6.108
+0.861
16.42%
1 ene 1968 año
6.033
-0.074
-1.22%
1 ene 1969 año
6.823
+0.789
13.08%
1 ene 1970 año
6.725
-0.098
-1.44%
1 ene 1971 año
2.872
-3.852
-57.29%
1 ene 1972 año
3.3
+0.428
14.89%
1 ene 1973 año
3.538
+0.239
7.23%
1 ene 1974 año
3.52
-0.018
-0.52%
1 ene 1975 año
3.51
-0.01
-0.28%
1 ene 1976 año
3.583
+0.073
2.07%
1 ene 1977 año
3.639
+0.056
1.56%
1 ene 1978 año
3.81
+0.171
4.7%
1 ene 1979 año
4.203
+0.393
10.31%
1 ene 1980 año
4.196
-0.007
-0.16%
1 ene 1981 año
4.291
+0.095
2.25%
1 ene 1982 año
4.344
+0.053
1.24%
1 ene 1983 año
2.602
-1.742
-40.11%
1 ene 1984 año
2.659
+0.058
2.21%
1 ene 1985 año
2.816
+0.157
5.9%
1 ene 1986 año
2.767
-0.049
-1.73%
1 ene 1987 año
2.891
+0.123
4.46%
1 ene 1988 año
3.079
+0.188
6.52%
1 ene 1989 año
3.1
+0.021
0.67%
1 ene 1990 año
2.975
-0.124
-4.01%
1 ene 1991 año
2.002
-0.973
-32.7%
1 ene 1992 año
2.084
+0.082
4.08%
1 ene 1993 año
2.022
-0.062
-2.96%
1 ene 1994 año
1.936
-0.086
-4.26%
1 ene 1995 año
1.79
-0.146
-7.56%
1 ene 1996 año
1.717
-0.073
-4.09%
1 ene 1997 año
1.76
+0.043
2.51%
1 ene 1998 año
1.699
-0.06
-3.43%
1 ene 1999 año
1.692
-0.008
-0.45%
1 ene 2000 año
1.572
-0.119
-7.05%
1 ene 2001 año
1.387
-0.186
-11.8%
1 ene 2002 año
1.371
-0.016
-1.14%
1 ene 2003 año
1.341
-0.03
-2.21%
1 ene 2004 año
1.299
-0.041
-3.09%
1 ene 2005 año
1.296
-0.003
-0.23%
1 ene 2006 año
1.259
-0.037
-2.88%
1 ene 2007 año
1.13
-0.129
-10.24%
1 ene 2008 año
1.012
-0.118
-10.49%
1 ene 2009 año
0.92
-0.092
-9.07%
1 ene 2010 año
0.951
+0.031
3.42%
1 ene 2011 año
0.913
-0.038
-4.04%
1 ene 2012 año
0.878
-0.035
-3.84%
1 ene 2013 año
0.9
+0.022
2.48%
1 ene 2014 año
0.907
+0.007
0.81%
Ranking de los países por los datos estadísticos actuales


Comentarios: