29
/es/
es
AIzaSyAYiBZKx7MnpbEhh9jyipgxe19OcubqV5w
April 1, 2024
35318
Heavily indebted poor countries (HIPC)
HPC
false
2
1
Primary completion rate, male (% of relevant age group)
2015,2014,2013,2012,2011,2010,2009,2008,2007,2006,2005,2004,2003,2002,2001,2000,1999,1998,1997,1996,1995,1994,1993,1992,1991,1990,1989,1988,1987,1986,1985,1984,1983,1982,1981,1980,1979,1978,1977,1976,1975,1974,1973
Estas estadísticas en otros países:
AfghanistanAlbaniaAlgeriaAngolaAntigua and BarbudaArab WorldArgentinaArmeniaArubaAustriaAzerbaijanBahamas, TheBahrainBangladeshBarbadosBelarusBelgiumBelizeBeninBermudaBhutanBoliviaBosnia and HerzegovinaBotswanaBrunei DarussalamBulgariaBurkina FasoBurundiCabo VerdeCambodiaCameroonCanadaCaribbean small statesCentral African RepublicCentral Europe and the BalticsChadChileChinaColombiaComorosCongo, Dem. Rep.Congo, Rep.Costa RicaCote d'IvoireCroatiaCubaCyprusCzech RepublicDenmarkDjiboutiDominicaDominican RepublicEarly-demographic dividendEast Asia & PacificEast Asia & Pacific (excluding high income)East Asia & Pacific (IDA & IBRD countries)EcuadorEgypt, Arab Rep.El SalvadorEquatorial GuineaEritreaEstoniaEthiopiaEuro areaEurope & Central AsiaEurope & Central Asia (excluding high income)Europe & Central Asia (IDA & IBRD countries)European UnionFijiFinlandFragile and conflict affected situationsFranceGabonGambia, TheGeorgiaGermanyGhanaGreeceGrenadaGuatemalaGuineaGuinea-BissauGuyanaHaitiHeavily indebted poor countries (HIPC)High incomeHondurasHong Kong SAR, ChinaHungaryIBRD onlyIcelandIDA & IBRD totalIDA blendIDA onlyIDA totalIndiaIndonesiaIran, Islamic Rep.IraqIrelandIsraelItalyJamaicaJapanJordanKazakhstanKenyaKiribatiKorea, Dem. People’s Rep.Korea, Rep.KuwaitKyrgyz RepublicLao PDRLate-demographic dividendLatin America & Caribbean Latin America & Caribbean (excluding high income)Latin America & the Caribbean (IDA & IBRD countries)LatviaLeast developed countries: UN classificationLebanonLesothoLiberiaLibyaLiechtensteinLithuaniaLow & middle incomeLow incomeLower middle incomeLuxembourgMacao SAR, ChinaMacedonia, FYRMadagascarMalawiMaldivesMaliMaltaMarshall IslandsMauritaniaMauritiusMexicoMiddle East & North AfricaMiddle East & North Africa (excluding high income)Middle East & North Africa (IDA & IBRD countries)Middle incomeMoldovaMongoliaMontenegroMoroccoMozambiqueMyanmarNamibiaNauruNepalNetherlandsNew ZealandNicaraguaNigerNigeriaNorwayOECD membersOmanOther small statesPacific island small statesPakistanPalauPanamaPapua New GuineaParaguayPeruPhilippinesPolandPortugalPost-demographic dividendPre-demographic dividendQatarRomaniaRussian FederationRwandaSamoaSan MarinoSao Tome and PrincipeSaudi ArabiaSenegalSerbiaSeychellesSierra LeoneSlovak RepublicSloveniaSmall statesSolomon IslandsSouth AfricaSouth AsiaSouth Asia (IDA & IBRD)South SudanSpainSri LankaSt. Kitts and NevisSt. LuciaSt. Vincent and the GrenadinesSub-Saharan Africa Sub-Saharan Africa (excluding high income)Sub-Saharan Africa (IDA & IBRD countries)SudanSurinameSwazilandSwedenSwitzerlandSyrian Arab RepublicTajikistanTanzaniaThailandTimor-LesteTogoTongaTrinidad and TobagoTunisiaTurkeyTuvaluUgandaUkraineUnited Arab EmiratesUpper middle incomeUruguayUzbekistanVanuatuVenezuela, RBVietnamWest Bank and GazaWorldYemen, Rep.ZambiaZimbabwe línea de tiempo (timeline):
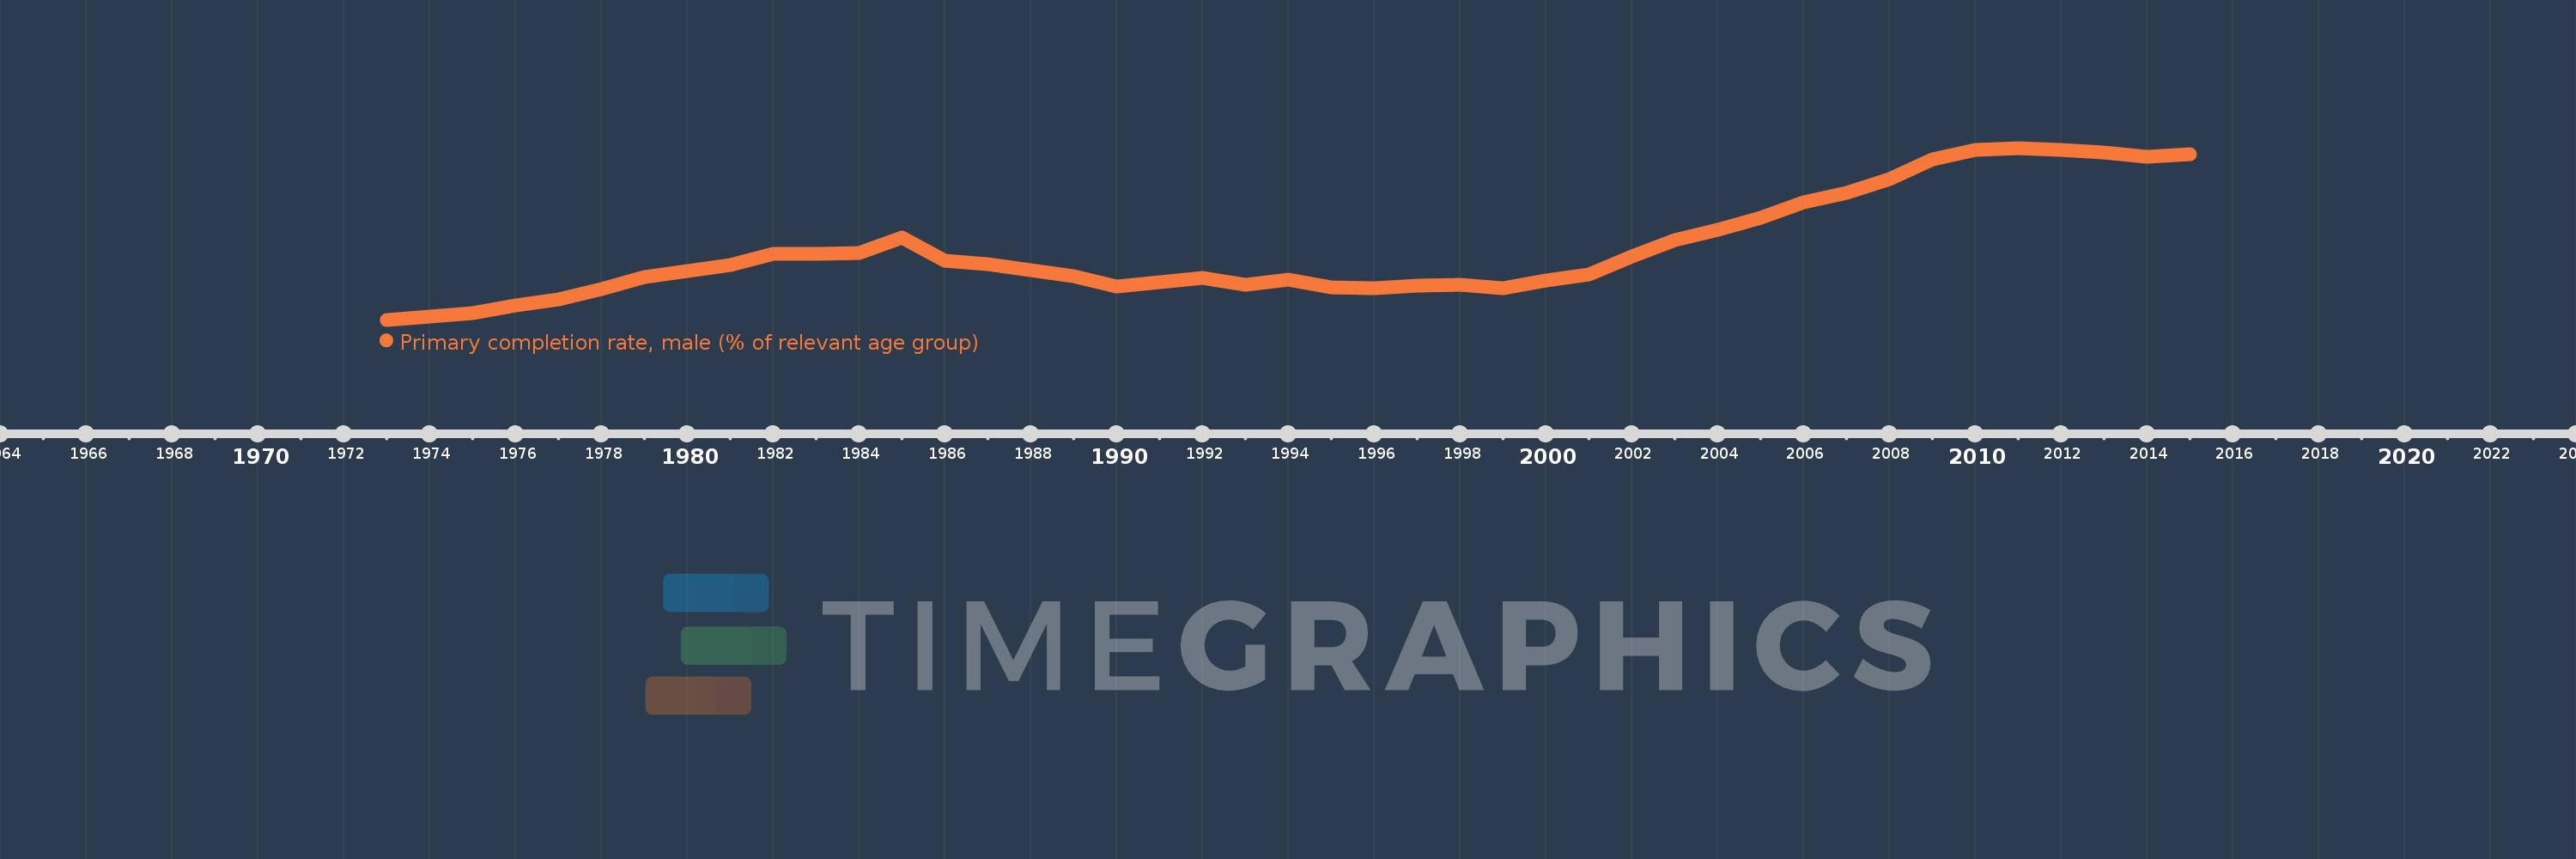
En esta escala de tiempo se presenta un gráfico de 1973 y 2015 de Heavily indebted poor countries (HIPC). Los datos de 1972 están ausentes. El número de observaciones reales por fecha: 43.
Fuente (nombre):
Indicadores del desarrollo mundial
Fuente (organización):
United Nations Educational, Scientific, and Cultural Organization (UNESCO) Institute for Statistics.
Categorías:
Education, Gender
Se ha actualizado:
23 abr 2017 año
Los indicadores de los cambios de valor en los últimos años
Mínimo:
40.86
1 ene 1973 año
Máximo:
69.359
1 ene 2011 año
A la fecha de observación
Valor
Cambio absoluto
El cambio con respecto al valor anterior
1 ene 1973 año
40.86
+40.86
0.0%
1 ene 1974 año
41.445
+0.585
1.43%
1 ene 1975 año
41.938
+0.494
1.19%
1 ene 1976 año
43.287
+1.348
3.21%
1 ene 1977 año
44.241
+0.955
2.21%
1 ene 1978 año
45.907
+1.665
3.76%
1 ene 1979 año
47.953
+2.046
4.46%
1 ene 1980 año
48.889
+0.936
1.95%
1 ene 1981 año
49.969
+1.08
2.21%
1 ene 1982 año
51.805
+1.835
3.67%
1 ene 1983 año
51.723
-0.082
-0.16%
1 ene 1984 año
51.948
+0.226
0.44%
1 ene 1985 año
54.517
+2.569
4.95%
1 ene 1986 año
50.586
-3.931
-7.21%
1 ene 1987 año
50.104
-0.482
-0.95%
1 ene 1988 año
49.147
-0.957
-1.91%
1 ene 1989 año
48.031
-1.116
-2.27%
1 ene 1990 año
46.385
-1.647
-3.43%
1 ene 1991 año
47.06
+0.675
1.45%
1 ene 1992 año
47.756
+0.696
1.48%
1 ene 1993 año
46.645
-1.111
-2.33%
1 ene 1994 año
47.583
+0.938
2.01%
1 ene 1995 año
46.191
-1.392
-2.92%
1 ene 1996 año
46.077
-0.114
-0.25%
1 ene 1997 año
46.553
+0.475
1.03%
1 ene 1998 año
46.657
+0.105
0.22%
1 ene 1999 año
46.109
-0.548
-1.18%
1 ene 2000 año
47.441
+1.332
2.89%
1 ene 2001 año
48.393
+0.952
2.01%
1 ene 2002 año
51.322
+2.93
6.05%
1 ene 2003 año
54.0
+2.678
5.22%
1 ene 2004 año
55.751
+1.75
3.24%
1 ene 2005 año
57.747
+1.996
3.58%
1 ene 2006 año
60.356
+2.61
4.52%
1 ene 2007 año
61.924
+1.567
2.6%
1 ene 2008 año
64.137
+2.213
3.57%
1 ene 2009 año
67.434
+3.297
5.14%
1 ene 2010 año
69.04
+1.607
2.38%
1 ene 2011 año
69.359
+0.319
0.46%
1 ene 2012 año
68.976
-0.382
-0.55%
1 ene 2013 año
68.588
-0.388
-0.56%
1 ene 2014 año
67.898
-0.69
-1.01%
1 ene 2015 año
68.283
+0.385
0.57%
Ranking de los países por los datos estadísticos actuales


Comentarios: