29
/es/
es
AIzaSyAYiBZKx7MnpbEhh9jyipgxe19OcubqV5w
April 1, 2024
111535
Congo, Rep.
COG
true
2
1
Primary completion rate, male (% of relevant age group)
2013,2012,2011,2010,2009,2008,2007,2006,2005,2004,2003,2002,2000,1997,1995,1994,1993,1992,1991,1990,1989,1988,1987,1986,1985,1984,1983,1982,1981,1980,1979,1978,1977,1976,1975,1974,1973
Estas estadísticas en otros países:
AfghanistanAlbaniaAlgeriaAngolaAntigua and BarbudaArab WorldArgentinaArmeniaArubaAustriaAzerbaijanBahamas, TheBahrainBangladeshBarbadosBelarusBelgiumBelizeBeninBermudaBhutanBoliviaBosnia and HerzegovinaBotswanaBrunei DarussalamBulgariaBurkina FasoBurundiCabo VerdeCambodiaCameroonCanadaCaribbean small statesCentral African RepublicCentral Europe and the BalticsChadChileChinaColombiaComorosCongo, Dem. Rep.Congo, Rep.Costa RicaCote d'IvoireCroatiaCubaCyprusCzech RepublicDenmarkDjiboutiDominicaDominican RepublicEarly-demographic dividendEast Asia & PacificEast Asia & Pacific (excluding high income)East Asia & Pacific (IDA & IBRD countries)EcuadorEgypt, Arab Rep.El SalvadorEquatorial GuineaEritreaEstoniaEthiopiaEuro areaEurope & Central AsiaEurope & Central Asia (excluding high income)Europe & Central Asia (IDA & IBRD countries)European UnionFijiFinlandFragile and conflict affected situationsFranceGabonGambia, TheGeorgiaGermanyGhanaGreeceGrenadaGuatemalaGuineaGuinea-BissauGuyanaHaitiHeavily indebted poor countries (HIPC)High incomeHondurasHong Kong SAR, ChinaHungaryIBRD onlyIcelandIDA & IBRD totalIDA blendIDA onlyIDA totalIndiaIndonesiaIran, Islamic Rep.IraqIrelandIsraelItalyJamaicaJapanJordanKazakhstanKenyaKiribatiKorea, Dem. People’s Rep.Korea, Rep.KuwaitKyrgyz RepublicLao PDRLate-demographic dividendLatin America & Caribbean Latin America & Caribbean (excluding high income)Latin America & the Caribbean (IDA & IBRD countries)LatviaLeast developed countries: UN classificationLebanonLesothoLiberiaLibyaLiechtensteinLithuaniaLow & middle incomeLow incomeLower middle incomeLuxembourgMacao SAR, ChinaMacedonia, FYRMadagascarMalawiMaldivesMaliMaltaMarshall IslandsMauritaniaMauritiusMexicoMiddle East & North AfricaMiddle East & North Africa (excluding high income)Middle East & North Africa (IDA & IBRD countries)Middle incomeMoldovaMongoliaMontenegroMoroccoMozambiqueMyanmarNamibiaNauruNepalNetherlandsNew ZealandNicaraguaNigerNigeriaNorwayOECD membersOmanOther small statesPacific island small statesPakistanPalauPanamaPapua New GuineaParaguayPeruPhilippinesPolandPortugalPost-demographic dividendPre-demographic dividendQatarRomaniaRussian FederationRwandaSamoaSan MarinoSao Tome and PrincipeSaudi ArabiaSenegalSerbiaSeychellesSierra LeoneSlovak RepublicSloveniaSmall statesSolomon IslandsSouth AfricaSouth AsiaSouth Asia (IDA & IBRD)South SudanSpainSri LankaSt. Kitts and NevisSt. LuciaSt. Vincent and the GrenadinesSub-Saharan Africa Sub-Saharan Africa (excluding high income)Sub-Saharan Africa (IDA & IBRD countries)SudanSurinameSwazilandSwedenSwitzerlandSyrian Arab RepublicTajikistanTanzaniaThailandTimor-LesteTogoTongaTrinidad and TobagoTunisiaTurkeyTuvaluUgandaUkraineUnited Arab EmiratesUpper middle incomeUruguayUzbekistanVanuatuVenezuela, RBVietnamWest Bank and GazaWorldYemen, Rep.ZambiaZimbabwe línea de tiempo (timeline):
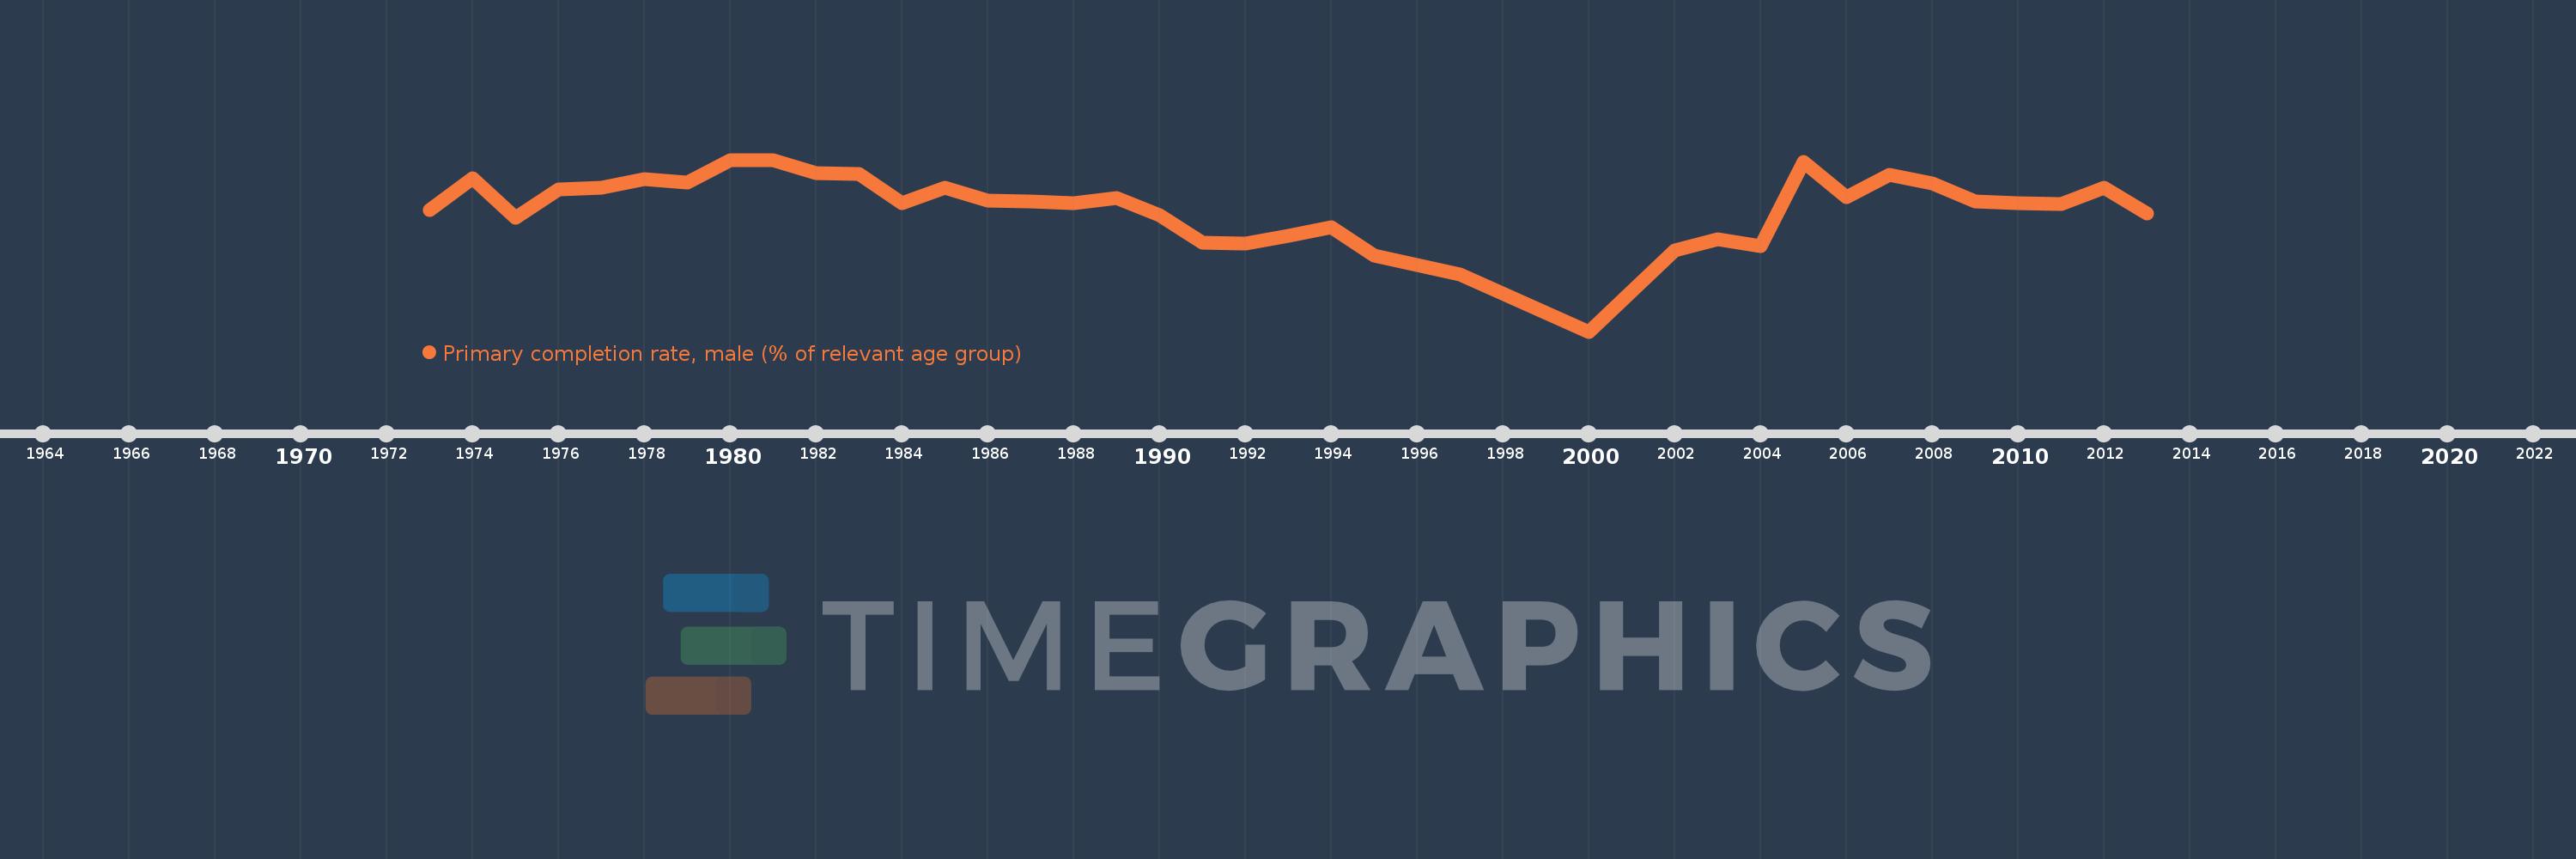
En esta escala de tiempo se presenta un gráfico de 1973 y 2013 de Congo, Rep.. Los datos de 1972 están ausentes. El número de observaciones reales por fecha: 37.
Fuente (nombre):
Indicadores del desarrollo mundial
Fuente (organización):
United Nations Educational, Scientific, and Cultural Organization (UNESCO) Institute for Statistics.
Categorías:
Education, Gender
Se ha actualizado:
23 abr 2017 año
Los indicadores de los cambios de valor en los últimos años
Mínimo:
31.299
1 ene 2000 año
Máximo:
87.373
1 ene 1980 año
A la fecha de observación
Valor
Cambio absoluto
El cambio con respecto al valor anterior
1 ene 1973 año
71.028
+71.028
0.0%
1 ene 1974 año
81.425
+10.397
14.64%
1 ene 1975 año
68.434
-12.991
-15.95%
1 ene 1976 año
77.761
+9.327
13.63%
1 ene 1977 año
78.291
+0.53
0.68%
1 ene 1978 año
81.015
+2.723
3.48%
1 ene 1979 año
80.01
-1.005
-1.24%
1 ene 1980 año
87.373
+7.364
9.2%
1 ene 1981 año
87.128
-0.245
-0.28%
1 ene 1982 año
82.975
-4.153
-4.77%
1 ene 1983 año
82.803
-0.173
-0.21%
1 ene 1984 año
73.117
-9.685
-11.7%
1 ene 1985 año
78.146
+5.029
6.88%
1 ene 1986 año
73.961
-4.185
-5.35%
1 ene 1987 año
73.873
-0.088
-0.12%
1 ene 1988 año
73.267
-0.606
-0.82%
1 ene 1989 año
74.788
+1.521
2.08%
1 ene 1990 año
69.36
-5.428
-7.26%
1 ene 1991 año
60.36
-8.999
-12.98%
1 ene 1992 año
60.061
-0.299
-0.49%
1 ene 1993 año
62.445
+2.384
3.97%
1 ene 1994 año
65.253
+2.808
4.5%
1 ene 1995 año
56.001
-9.252
-14.18%
1 ene 1997 año
49.806
-6.195
-11.06%
1 ene 2000 año
31.299
-18.507
-37.16%
1 ene 2002 año
57.724
+26.425
84.43%
1 ene 2003 año
61.383
+3.659
6.34%
1 ene 2004 año
59.174
-2.209
-3.6%
1 ene 2005 año
86.602
+27.428
46.35%
1 ene 2006 año
75.081
-11.521
-13.3%
1 ene 2007 año
82.492
+7.411
9.87%
1 ene 2008 año
79.574
-2.918
-3.54%
1 ene 2009 año
73.706
-5.868
-7.37%
1 ene 2010 año
73.322
-0.384
-0.52%
1 ene 2011 año
72.962
-0.36
-0.49%
1 ene 2012 año
78.307
+5.344
7.32%
1 ene 2013 año
69.872
-8.435
-10.77%
Ranking de los países por los datos estadísticos actuales


Comentarios: