29
/es/
es
AIzaSyAYiBZKx7MnpbEhh9jyipgxe19OcubqV5w
April 1, 2024
34561
Fragile and conflict affected situations
FCS
false
2
1
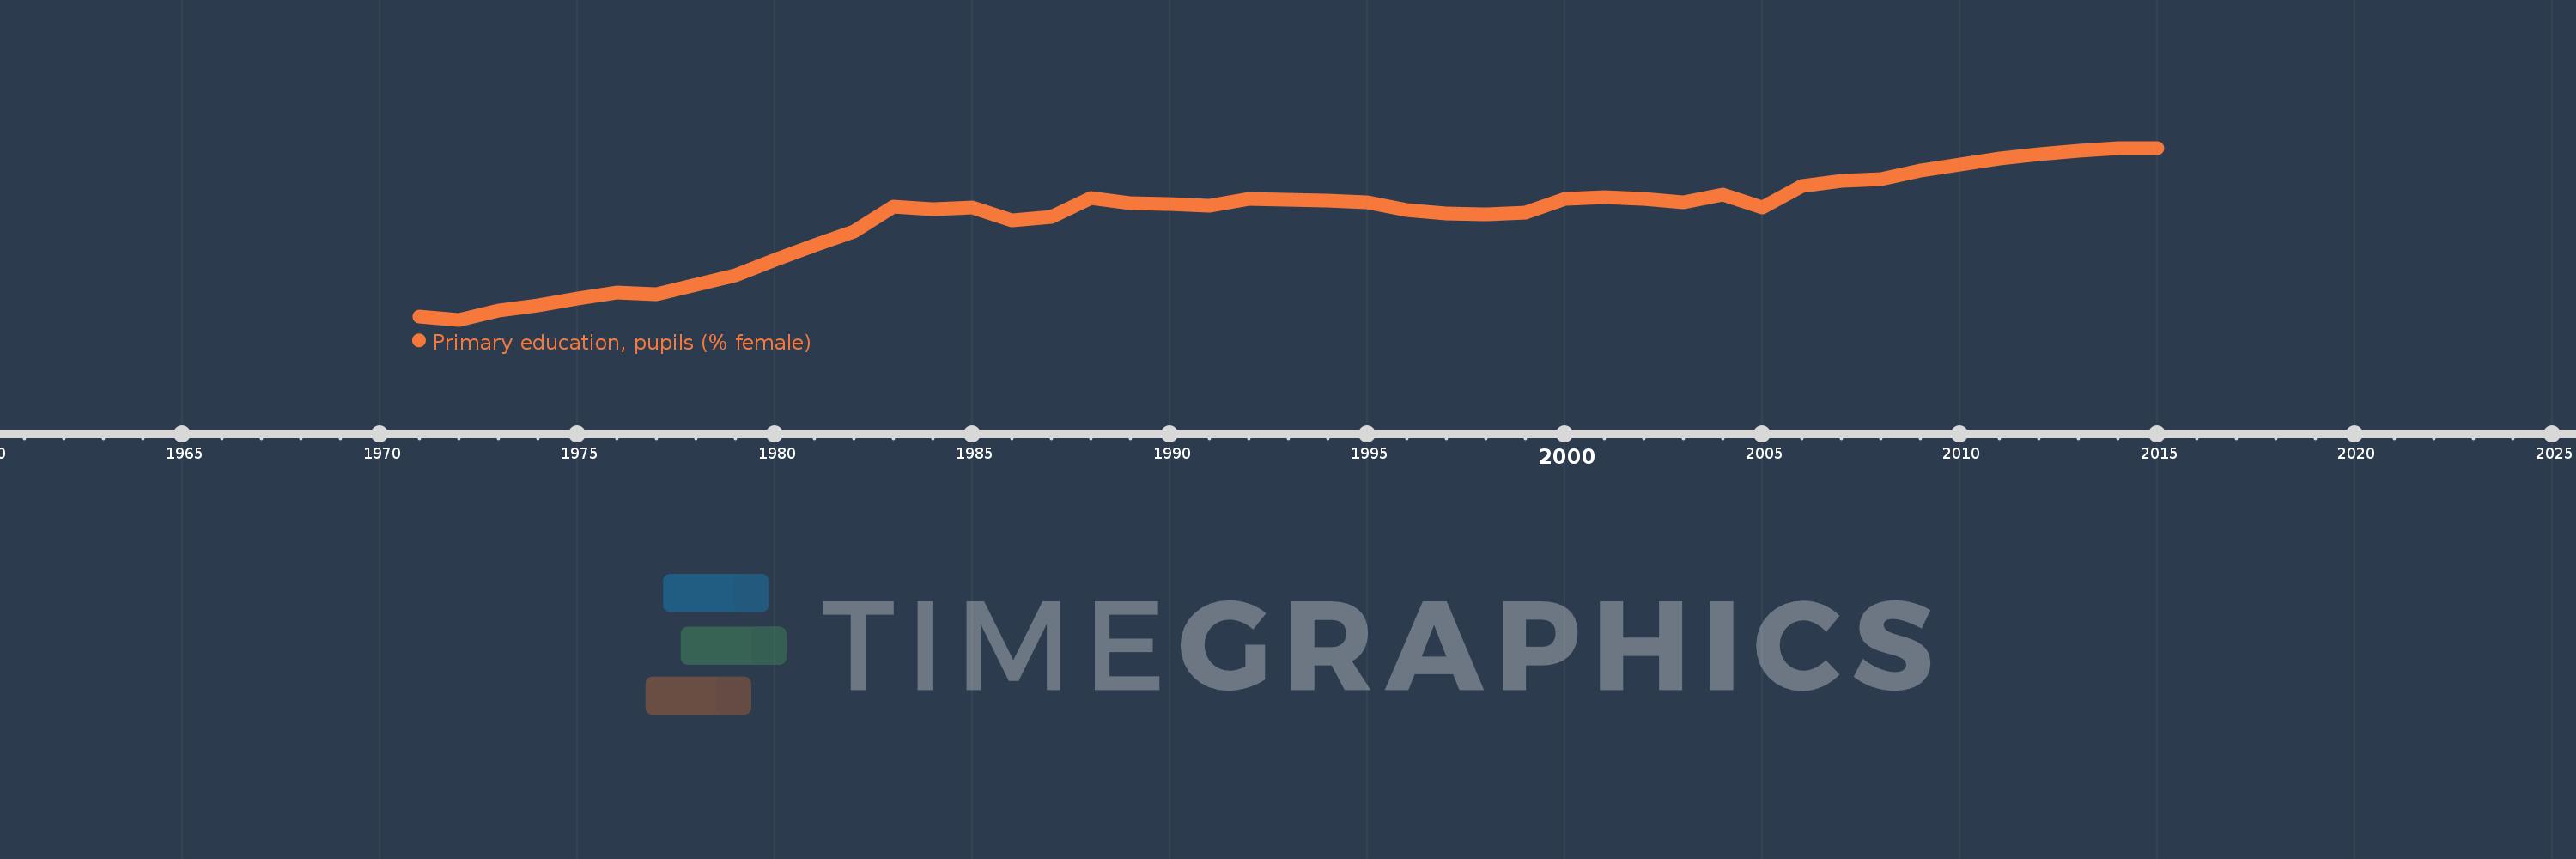
Primary education, pupils (% female)
2015,2014,2013,2012,2011,2010,2009,2008,2007,2006,2005,2004,2003,2002,2001,2000,1999,1998,1997,1996,1995,1994,1993,1992,1991,1990,1989,1988,1987,1986,1985,1984,1983,1982,1981,1980,1979,1978,1977,1976,1975,1974,1973,1972,1971
Estas estadísticas en otros países:
AfghanistanAlbaniaAlgeriaAndorraAngolaAntigua and BarbudaArab WorldArgentinaArmeniaArubaAustraliaAustriaAzerbaijanBahamas, TheBahrainBangladeshBarbadosBelarusBelgiumBelizeBeninBermudaBhutanBoliviaBosnia and HerzegovinaBotswanaBrazilBritish Virgin IslandsBrunei DarussalamBulgariaBurkina FasoBurundiCabo VerdeCambodiaCameroonCanadaCaribbean small statesCayman IslandsCentral African RepublicCentral Europe and the BalticsChadChileChinaColombiaComorosCongo, Dem. Rep.Congo, Rep.Costa RicaCote d'IvoireCroatiaCubaCuracaoCyprusCzech RepublicDenmarkDjiboutiDominicaDominican RepublicEarly-demographic dividendEast Asia & PacificEast Asia & Pacific (excluding high income)East Asia & Pacific (IDA & IBRD countries)EcuadorEgypt, Arab Rep.El SalvadorEquatorial GuineaEritreaEstoniaEthiopiaEuro areaEurope & Central AsiaEurope & Central Asia (excluding high income)Europe & Central Asia (IDA & IBRD countries)European UnionFijiFinlandFragile and conflict affected situationsFranceGabonGambia, TheGeorgiaGermanyGhanaGibraltarGreeceGrenadaGuatemalaGuineaGuinea-BissauGuyanaHaitiHeavily indebted poor countries (HIPC)High incomeHondurasHong Kong SAR, ChinaHungaryIBRD onlyIcelandIDA & IBRD totalIDA blendIDA onlyIDA totalIndiaIndonesiaIran, Islamic Rep.IraqIrelandIsraelItalyJamaicaJapanJordanKazakhstanKenyaKiribatiKorea, Dem. People’s Rep.Korea, Rep.KuwaitKyrgyz RepublicLao PDRLate-demographic dividendLatin America & Caribbean Latin America & Caribbean (excluding high income)Latin America & the Caribbean (IDA & IBRD countries)LatviaLeast developed countries: UN classificationLebanonLesothoLiberiaLibyaLiechtensteinLithuaniaLow & middle incomeLow incomeLower middle incomeLuxembourgMacao SAR, ChinaMacedonia, FYRMadagascarMalawiMalaysiaMaldivesMaliMaltaMarshall IslandsMauritaniaMauritiusMexicoMicronesia, Fed. Sts.Middle East & North AfricaMiddle East & North Africa (excluding high income)Middle East & North Africa (IDA & IBRD countries)Middle incomeMoldovaMonacoMongoliaMontenegroMoroccoMozambiqueMyanmarNamibiaNauruNepalNetherlandsNew ZealandNicaraguaNigerNigeriaNorth AmericaNorwayOECD membersOmanOther small statesPacific island small statesPakistanPalauPanamaPapua New GuineaParaguayPeruPhilippinesPolandPortugalPost-demographic dividendPre-demographic dividendPuerto RicoQatarRomaniaRussian FederationRwandaSamoaSan MarinoSao Tome and PrincipeSaudi ArabiaSenegalSerbiaSeychellesSierra LeoneSingaporeSint Maarten (Dutch part)Slovak RepublicSloveniaSmall statesSolomon IslandsSomaliaSouth AfricaSouth AsiaSouth Asia (IDA & IBRD)South SudanSpainSri LankaSt. Kitts and NevisSt. LuciaSt. Vincent and the GrenadinesSub-Saharan Africa Sub-Saharan Africa (excluding high income)Sub-Saharan Africa (IDA & IBRD countries)SudanSurinameSwazilandSwedenSwitzerlandSyrian Arab RepublicTajikistanTanzaniaThailandTimor-LesteTogoTongaTrinidad and TobagoTunisiaTurkeyTurkmenistanTurks and Caicos IslandsTuvaluUgandaUkraineUnited Arab EmiratesUnited KingdomUnited StatesUpper middle incomeUruguayUzbekistanVanuatuVenezuela, RBVietnamWest Bank and GazaWorldYemen, Rep.ZambiaZimbabwe línea de tiempo (timeline):
En esta escala de tiempo se presenta un gráfico de 1971 y 2015 de Fragile and conflict affected situations. Los datos de 1970 están ausentes. El número de observaciones reales por fecha: 45.
Fuente (nombre):
Indicadores del desarrollo mundial
Fuente (organización):
United Nations Educational, Scientific, and Cultural Organization (UNESCO) Institute for Statistics.
Categorías:
Education, Gender
Se ha actualizado:
23 abr 2017 año
Los indicadores de los cambios de valor en los últimos años
Mínimo:
39.591
1 ene 1972 año
Máximo:
46.332
1 ene 2015 año
A la fecha de observación
Valor
Cambio absoluto
El cambio con respecto al valor anterior
1 ene 1971 año
39.714
+39.714
0.0%
1 ene 1972 año
39.591
-0.123
-0.31%
1 ene 1973 año
39.965
+0.374
0.94%
1 ene 1974 año
40.15
+0.185
0.46%
1 ene 1975 año
40.437
+0.287
0.72%
1 ene 1976 año
40.655
+0.217
0.54%
1 ene 1977 año
40.593
-0.061
-0.15%
1 ene 1978 año
40.955
+0.362
0.89%
1 ene 1979 año
41.337
+0.382
0.93%
1 ene 1980 año
41.94
+0.603
1.46%
1 ene 1981 año
42.513
+0.573
1.37%
1 ene 1982 año
43.05
+0.537
1.26%
1 ene 1983 año
44.04
+0.991
2.3%
1 ene 1984 año
43.941
-0.1
-0.23%
1 ene 1985 año
43.995
+0.055
0.12%
1 ene 1986 año
43.477
-0.518
-1.18%
1 ene 1987 año
43.642
+0.165
0.38%
1 ene 1988 año
44.371
+0.729
1.67%
1 ene 1989 año
44.151
-0.22
-0.49%
1 ene 1990 año
44.138
-0.013
-0.03%
1 ene 1991 año
44.08
-0.058
-0.13%
1 ene 1992 año
44.334
+0.255
0.58%
1 ene 1993 año
44.306
-0.029
-0.06%
1 ene 1994 año
44.279
-0.027
-0.06%
1 ene 1995 año
44.204
-0.075
-0.17%
1 ene 1996 año
43.891
-0.313
-0.71%
1 ene 1997 año
43.762
-0.129
-0.29%
1 ene 1998 año
43.725
-0.036
-0.08%
1 ene 1999 año
43.783
+0.058
0.13%
1 ene 2000 año
44.339
+0.556
1.27%
1 ene 2001 año
44.397
+0.058
0.13%
1 ene 2002 año
44.328
-0.069
-0.16%
1 ene 2003 año
44.19
-0.138
-0.31%
1 ene 2004 año
44.499
+0.309
0.7%
1 ene 2005 año
43.987
-0.512
-1.15%
1 ene 2006 año
44.843
+0.857
1.95%
1 ene 2007 año
45.04
+0.197
0.44%
1 ene 2008 año
45.116
+0.076
0.17%
1 ene 2009 año
45.434
+0.317
0.7%
1 ene 2010 año
45.686
+0.252
0.56%
1 ene 2011 año
45.929
+0.243
0.53%
1 ene 2012 año
46.071
+0.142
0.31%
1 ene 2013 año
46.218
+0.147
0.32%
1 ene 2014 año
46.306
+0.089
0.19%
1 ene 2015 año
46.332
+0.026
0.06%
Ranking de los países por los datos estadísticos actuales


Comentarios: