29
/es/
es
AIzaSyAYiBZKx7MnpbEhh9jyipgxe19OcubqV5w
April 1, 2024
137300
Gambia, The
GMB
true
2
1
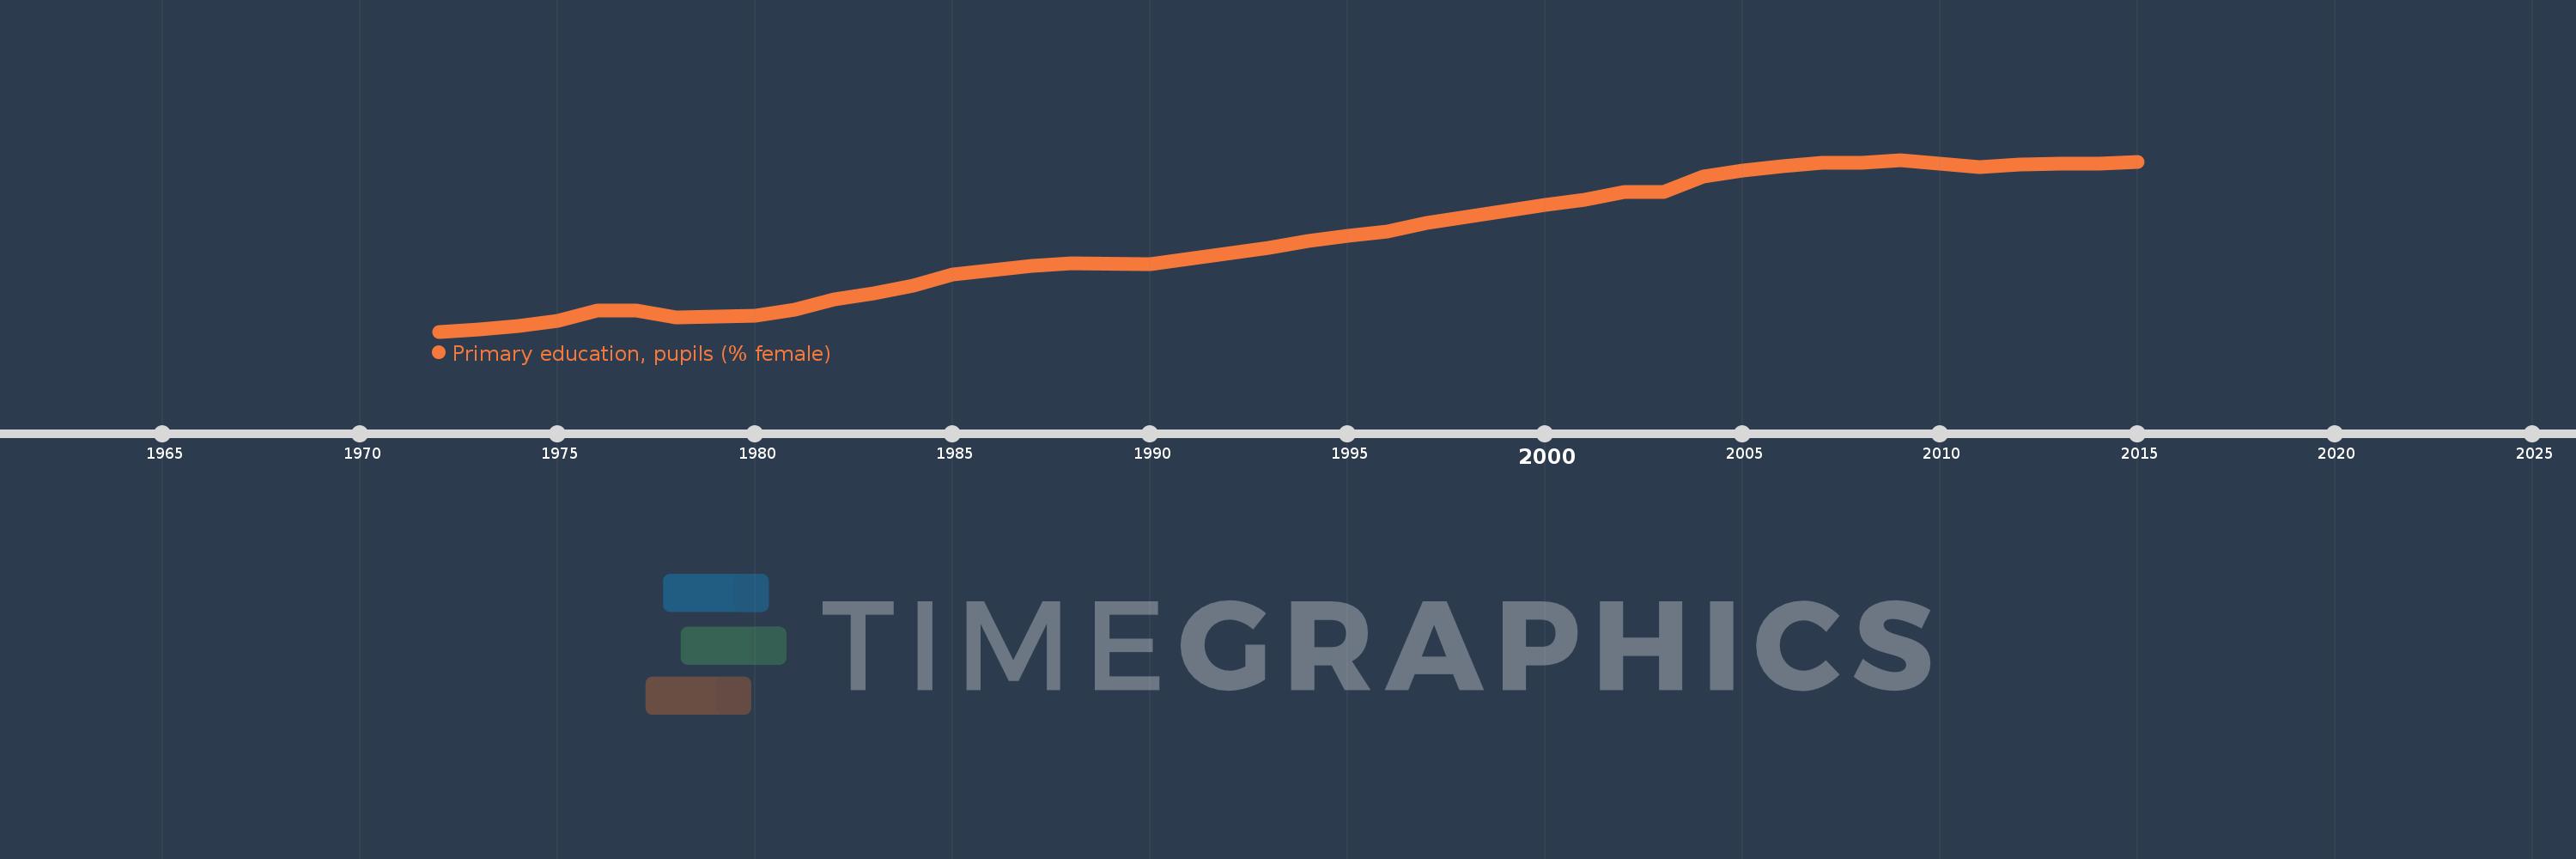
Primary education, pupils (% female)
2015,2014,2013,2012,2011,2009,2008,2007,2006,2005,2004,2003,2002,2001,2000,1999,1998,1997,1996,1995,1994,1993,1990,1988,1987,1986,1985,1984,1983,1982,1981,1980,1979,1978,1977,1976,1975,1974,1973,1972
Estas estadísticas en otros países:
AfghanistanAlbaniaAlgeriaAndorraAngolaAntigua and BarbudaArab WorldArgentinaArmeniaArubaAustraliaAustriaAzerbaijanBahamas, TheBahrainBangladeshBarbadosBelarusBelgiumBelizeBeninBermudaBhutanBoliviaBosnia and HerzegovinaBotswanaBrazilBritish Virgin IslandsBrunei DarussalamBulgariaBurkina FasoBurundiCabo VerdeCambodiaCameroonCanadaCaribbean small statesCayman IslandsCentral African RepublicCentral Europe and the BalticsChadChileChinaColombiaComorosCongo, Dem. Rep.Congo, Rep.Costa RicaCote d'IvoireCroatiaCubaCuracaoCyprusCzech RepublicDenmarkDjiboutiDominicaDominican RepublicEarly-demographic dividendEast Asia & PacificEast Asia & Pacific (excluding high income)East Asia & Pacific (IDA & IBRD countries)EcuadorEgypt, Arab Rep.El SalvadorEquatorial GuineaEritreaEstoniaEthiopiaEuro areaEurope & Central AsiaEurope & Central Asia (excluding high income)Europe & Central Asia (IDA & IBRD countries)European UnionFijiFinlandFragile and conflict affected situationsFranceGabonGambia, TheGeorgiaGermanyGhanaGibraltarGreeceGrenadaGuatemalaGuineaGuinea-BissauGuyanaHaitiHeavily indebted poor countries (HIPC)High incomeHondurasHong Kong SAR, ChinaHungaryIBRD onlyIcelandIDA & IBRD totalIDA blendIDA onlyIDA totalIndiaIndonesiaIran, Islamic Rep.IraqIrelandIsraelItalyJamaicaJapanJordanKazakhstanKenyaKiribatiKorea, Dem. People’s Rep.Korea, Rep.KuwaitKyrgyz RepublicLao PDRLate-demographic dividendLatin America & Caribbean Latin America & Caribbean (excluding high income)Latin America & the Caribbean (IDA & IBRD countries)LatviaLeast developed countries: UN classificationLebanonLesothoLiberiaLibyaLiechtensteinLithuaniaLow & middle incomeLow incomeLower middle incomeLuxembourgMacao SAR, ChinaMacedonia, FYRMadagascarMalawiMalaysiaMaldivesMaliMaltaMarshall IslandsMauritaniaMauritiusMexicoMicronesia, Fed. Sts.Middle East & North AfricaMiddle East & North Africa (excluding high income)Middle East & North Africa (IDA & IBRD countries)Middle incomeMoldovaMonacoMongoliaMontenegroMoroccoMozambiqueMyanmarNamibiaNauruNepalNetherlandsNew ZealandNicaraguaNigerNigeriaNorth AmericaNorwayOECD membersOmanOther small statesPacific island small statesPakistanPalauPanamaPapua New GuineaParaguayPeruPhilippinesPolandPortugalPost-demographic dividendPre-demographic dividendPuerto RicoQatarRomaniaRussian FederationRwandaSamoaSan MarinoSao Tome and PrincipeSaudi ArabiaSenegalSerbiaSeychellesSierra LeoneSingaporeSint Maarten (Dutch part)Slovak RepublicSloveniaSmall statesSolomon IslandsSomaliaSouth AfricaSouth AsiaSouth Asia (IDA & IBRD)South SudanSpainSri LankaSt. Kitts and NevisSt. LuciaSt. Vincent and the GrenadinesSub-Saharan Africa Sub-Saharan Africa (excluding high income)Sub-Saharan Africa (IDA & IBRD countries)SudanSurinameSwazilandSwedenSwitzerlandSyrian Arab RepublicTajikistanTanzaniaThailandTimor-LesteTogoTongaTrinidad and TobagoTunisiaTurkeyTurkmenistanTurks and Caicos IslandsTuvaluUgandaUkraineUnited Arab EmiratesUnited KingdomUnited StatesUpper middle incomeUruguayUzbekistanVanuatuVenezuela, RBVietnamWest Bank and GazaWorldYemen, Rep.ZambiaZimbabwe línea de tiempo (timeline):
En esta escala de tiempo se presenta un gráfico de 1972 y 2015 de Gambia, The. Los datos de 1971 están ausentes. El número de observaciones reales por fecha: 40.
Fuente (nombre):
Indicadores del desarrollo mundial
Fuente (organización):
United Nations Educational, Scientific, and Cultural Organization (UNESCO) Institute for Statistics.
Categorías:
Education, Gender
Se ha actualizado:
23 abr 2017 año
Los indicadores de los cambios de valor en los últimos años
Mínimo:
30.636
1 ene 1972 año
Máximo:
51.154
1 ene 2009 año
A la fecha de observación
Valor
Cambio absoluto
El cambio con respecto al valor anterior
1 ene 1972 año
30.636
+30.636
0.0%
1 ene 1973 año
30.894
+0.258
0.84%
1 ene 1974 año
31.255
+0.361
1.17%
1 ene 1975 año
31.876
+0.621
1.99%
1 ene 1976 año
33.107
+1.231
3.86%
1 ene 1977 año
33.184
+0.077
0.23%
1 ene 1978 año
32.278
-0.907
-2.73%
1 ene 1979 año
32.406
+0.128
0.4%
1 ene 1980 año
32.529
+0.124
0.38%
1 ene 1981 año
33.292
+0.763
2.35%
1 ene 1982 año
34.5
+1.208
3.63%
1 ene 1983 año
35.245
+0.745
2.16%
1 ene 1984 año
36.085
+0.84
2.38%
1 ene 1985 año
37.47
+1.385
3.84%
1 ene 1986 año
37.953
+0.483
1.29%
1 ene 1987 año
38.481
+0.528
1.39%
1 ene 1988 año
38.819
+0.339
0.88%
1 ene 1990 año
38.739
-0.081
-0.21%
1 ene 1993 año
40.675
+1.936
5.0%
1 ene 1994 año
41.449
+0.774
1.9%
1 ene 1995 año
42.07
+0.621
1.5%
1 ene 1996 año
42.627
+0.556
1.32%
1 ene 1997 año
43.644
+1.018
2.39%
1 ene 1998 año
44.289
+0.645
1.48%
1 ene 1999 año
45.03
+0.741
1.67%
1 ene 2000 año
45.73
+0.699
1.55%
1 ene 2001 año
46.417
+0.687
1.5%
1 ene 2002 año
47.301
+0.884
1.9%
1 ene 2003 año
47.312
+0.011
0.02%
1 ene 2004 año
49.153
+1.841
3.89%
1 ene 2005 año
49.891
+0.738
1.5%
1 ene 2006 año
50.412
+0.521
1.04%
1 ene 2007 año
50.792
+0.38
0.75%
1 ene 2008 año
50.825
+0.033
0.06%
1 ene 2009 año
51.154
+0.329
0.65%
1 ene 2011 año
50.285
-0.868
-1.7%
1 ene 2012 año
50.558
+0.273
0.54%
1 ene 2013 año
50.716
+0.158
0.31%
1 ene 2014 año
50.683
-0.033
-0.07%
1 ene 2015 año
50.945
+0.262
0.52%
Ranking de los países por los datos estadísticos actuales


Comentarios: