29
/es/
es
AIzaSyAYiBZKx7MnpbEhh9jyipgxe19OcubqV5w
April 1, 2024
34080
Fragile and conflict affected situations
FCS
false
2
1
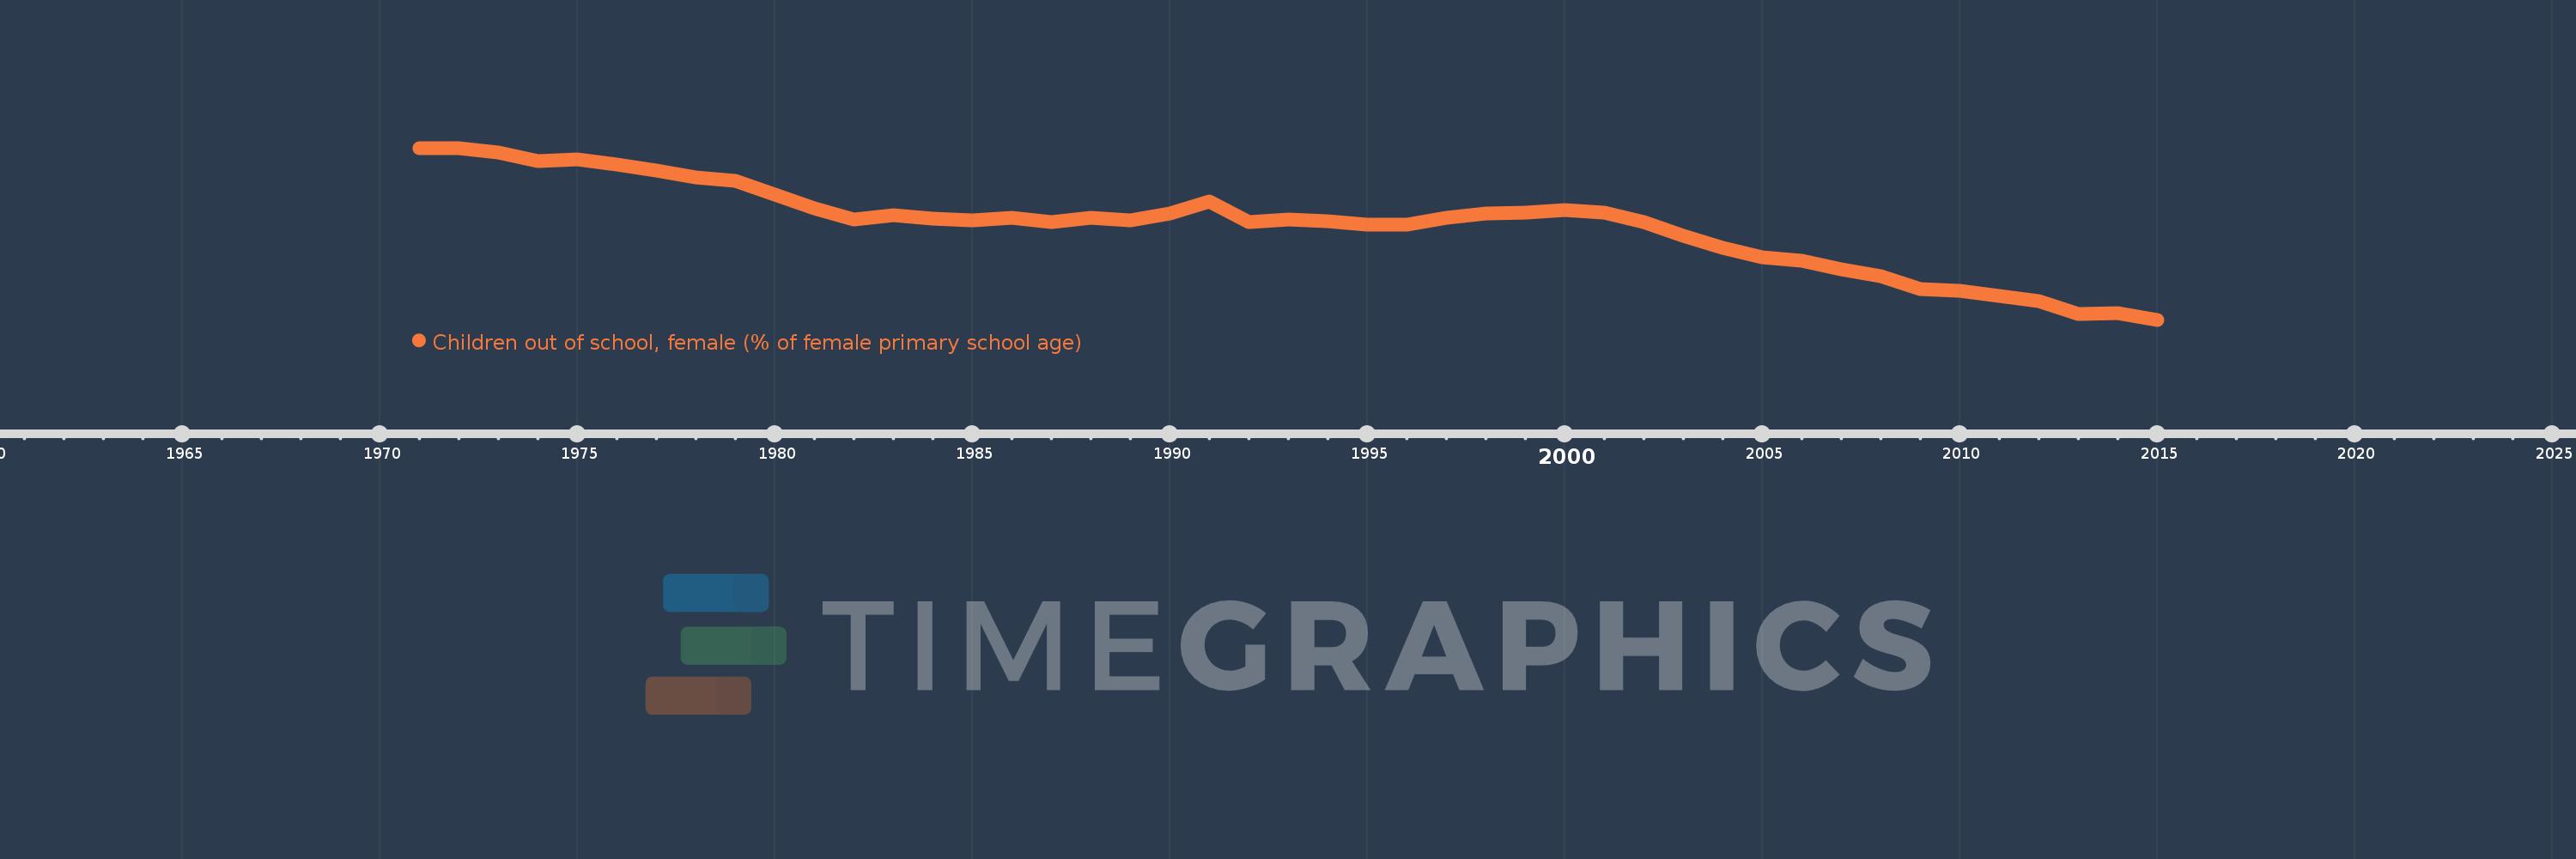
Children out of school, female (% of female primary school age)
2015,2014,2013,2012,2011,2010,2009,2008,2007,2006,2005,2004,2003,2002,2001,2000,1999,1998,1997,1996,1995,1994,1993,1992,1991,1990,1989,1988,1987,1986,1985,1984,1983,1982,1981,1980,1979,1978,1977,1976,1975,1974,1973,1972,1971
Estas estadísticas en otros países:
AfghanistanAlbaniaAlgeriaAngolaAntigua and BarbudaArab WorldArgentinaArmeniaArubaAustraliaAustriaAzerbaijanBahamas, TheBahrainBangladeshBarbadosBelarusBelgiumBelizeBeninBermudaBhutanBoliviaBosnia and HerzegovinaBotswanaBrazilBrunei DarussalamBulgariaBurkina FasoBurundiCabo VerdeCambodiaCameroonCanadaCaribbean small statesCentral African RepublicCentral Europe and the BalticsChadChileChinaColombiaComorosCongo, Dem. Rep.Congo, Rep.Costa RicaCote d'IvoireCroatiaCubaCyprusDenmarkDjiboutiDominicaDominican RepublicEarly-demographic dividendEast Asia & PacificEast Asia & Pacific (excluding high income)East Asia & Pacific (IDA & IBRD countries)EcuadorEgypt, Arab Rep.El SalvadorEquatorial GuineaEritreaEstoniaEthiopiaEuro areaEurope & Central AsiaEurope & Central Asia (excluding high income)Europe & Central Asia (IDA & IBRD countries)European UnionFijiFinlandFragile and conflict affected situationsFranceGabonGambia, TheGeorgiaGhanaGreeceGrenadaGuatemalaGuineaGuinea-BissauGuyanaHaitiHeavily indebted poor countries (HIPC)High incomeHondurasHong Kong SAR, ChinaHungaryIBRD onlyIcelandIDA & IBRD totalIDA blendIDA onlyIDA totalIndiaIndonesiaIran, Islamic Rep.IraqIrelandIsraelItalyJamaicaJapanJordanKazakhstanKenyaKiribatiKorea, Dem. People’s Rep.Korea, Rep.KuwaitKyrgyz RepublicLao PDRLate-demographic dividendLatin America & Caribbean Latin America & Caribbean (excluding high income)Latin America & the Caribbean (IDA & IBRD countries)LatviaLeast developed countries: UN classificationLebanonLesothoLiberiaLibyaLiechtensteinLithuaniaLow & middle incomeLow incomeLower middle incomeLuxembourgMacao SAR, ChinaMacedonia, FYRMadagascarMalawiMaldivesMaliMaltaMarshall IslandsMauritaniaMauritiusMexicoMicronesia, Fed. Sts.Middle East & North AfricaMiddle East & North Africa (excluding high income)Middle East & North Africa (IDA & IBRD countries)Middle incomeMoldovaMongoliaMontenegroMoroccoMozambiqueMyanmarNamibiaNauruNepalNetherlandsNew ZealandNicaraguaNigerNigeriaNorth AmericaNorwayOECD membersOmanOther small statesPacific island small statesPakistanPanamaPapua New GuineaParaguayPeruPhilippinesPolandPortugalPost-demographic dividendPre-demographic dividendPuerto RicoQatarRomaniaRussian FederationRwandaSamoaSan MarinoSao Tome and PrincipeSaudi ArabiaSenegalSerbiaSeychellesSierra LeoneSloveniaSmall statesSolomon IslandsSomaliaSouth AfricaSouth AsiaSouth Asia (IDA & IBRD)South SudanSpainSri LankaSt. Kitts and NevisSt. LuciaSt. Vincent and the GrenadinesSub-Saharan Africa Sub-Saharan Africa (excluding high income)Sub-Saharan Africa (IDA & IBRD countries)SudanSurinameSwazilandSwedenSwitzerlandSyrian Arab RepublicTajikistanTanzaniaThailandTimor-LesteTogoTongaTrinidad and TobagoTunisiaTurkeyTuvaluUgandaUkraineUnited Arab EmiratesUnited KingdomUnited StatesUpper middle incomeUruguayUzbekistanVanuatuVenezuela, RBWest Bank and GazaWorldYemen, Rep.ZambiaZimbabwe línea de tiempo (timeline):
En esta escala de tiempo se presenta un gráfico de 1971 y 2015 de Fragile and conflict affected situations. Los datos de 1970 están ausentes. El número de observaciones reales por fecha: 45.
Fuente (nombre):
Indicadores del desarrollo mundial
Fuente (organización):
United Nations Educational, Scientific, and Cultural Organization (UNESCO) Institute for Statistics.
Categorías:
Education
Se ha actualizado:
23 abr 2017 año
Los indicadores de los cambios de valor en los últimos años
Mínimo:
26.999
1 ene 2015 año
Máximo:
59.491
1 ene 1972 año
A la fecha de observación
Valor
Cambio absoluto
El cambio con respecto al valor anterior
1 ene 1971 año
59.417
+59.417
0.0%
1 ene 1972 año
59.491
+0.074
0.12%
1 ene 1973 año
58.574
-0.917
-1.54%
1 ene 1974 año
57.008
-1.566
-2.67%
1 ene 1975 año
57.273
+0.265
0.47%
1 ene 1976 año
56.426
-0.847
-1.48%
1 ene 1977 año
55.155
-1.272
-2.25%
1 ene 1978 año
53.978
-1.176
-2.13%
1 ene 1979 año
53.209
-0.77
-1.43%
1 ene 1980 año
50.702
-2.506
-4.71%
1 ene 1981 año
48.058
-2.644
-5.22%
1 ene 1982 año
45.919
-2.139
-4.45%
1 ene 1983 año
46.726
+0.807
1.76%
1 ene 1984 año
46.138
-0.588
-1.26%
1 ene 1985 año
45.856
-0.282
-0.61%
1 ene 1986 año
46.277
+0.421
0.92%
1 ene 1987 año
45.485
-0.792
-1.71%
1 ene 1988 año
46.267
+0.782
1.72%
1 ene 1989 año
45.783
-0.484
-1.05%
1 ene 1990 año
47.159
+1.377
3.01%
1 ene 1991 año
49.294
+2.134
4.53%
1 ene 1992 año
45.505
-3.789
-7.69%
1 ene 1993 año
46.036
+0.531
1.17%
1 ene 1994 año
45.676
-0.36
-0.78%
1 ene 1995 año
44.994
-0.682
-1.49%
1 ene 1996 año
45.038
+0.044
0.1%
1 ene 1997 año
46.318
+1.28
2.84%
1 ene 1998 año
47.125
+0.807
1.74%
1 ene 1999 año
47.202
+0.076
0.16%
1 ene 2000 año
47.779
+0.577
1.22%
1 ene 2001 año
47.227
-0.552
-1.16%
1 ene 2002 año
45.489
-1.737
-3.68%
1 ene 2003 año
42.804
-2.685
-5.9%
1 ene 2004 año
40.593
-2.212
-5.17%
1 ene 2005 año
38.821
-1.772
-4.36%
1 ene 2006 año
38.129
-0.692
-1.78%
1 ene 2007 año
36.515
-1.614
-4.23%
1 ene 2008 año
35.188
-1.328
-3.64%
1 ene 2009 año
32.852
-2.336
-6.64%
1 ene 2010 año
32.426
-0.425
-1.3%
1 ene 2011 año
31.571
-0.855
-2.64%
1 ene 2012 año
30.478
-1.093
-3.46%
1 ene 2013 año
28.054
-2.424
-7.95%
1 ene 2014 año
28.178
+0.124
0.44%
1 ene 2015 año
26.999
-1.179
-4.18%
Ranking de los países por los datos estadísticos actuales


Comentarios: