29
/es/
es
AIzaSyAYiBZKx7MnpbEhh9jyipgxe19OcubqV5w
April 1, 2024
141595
Greece
GRC
true
2
1
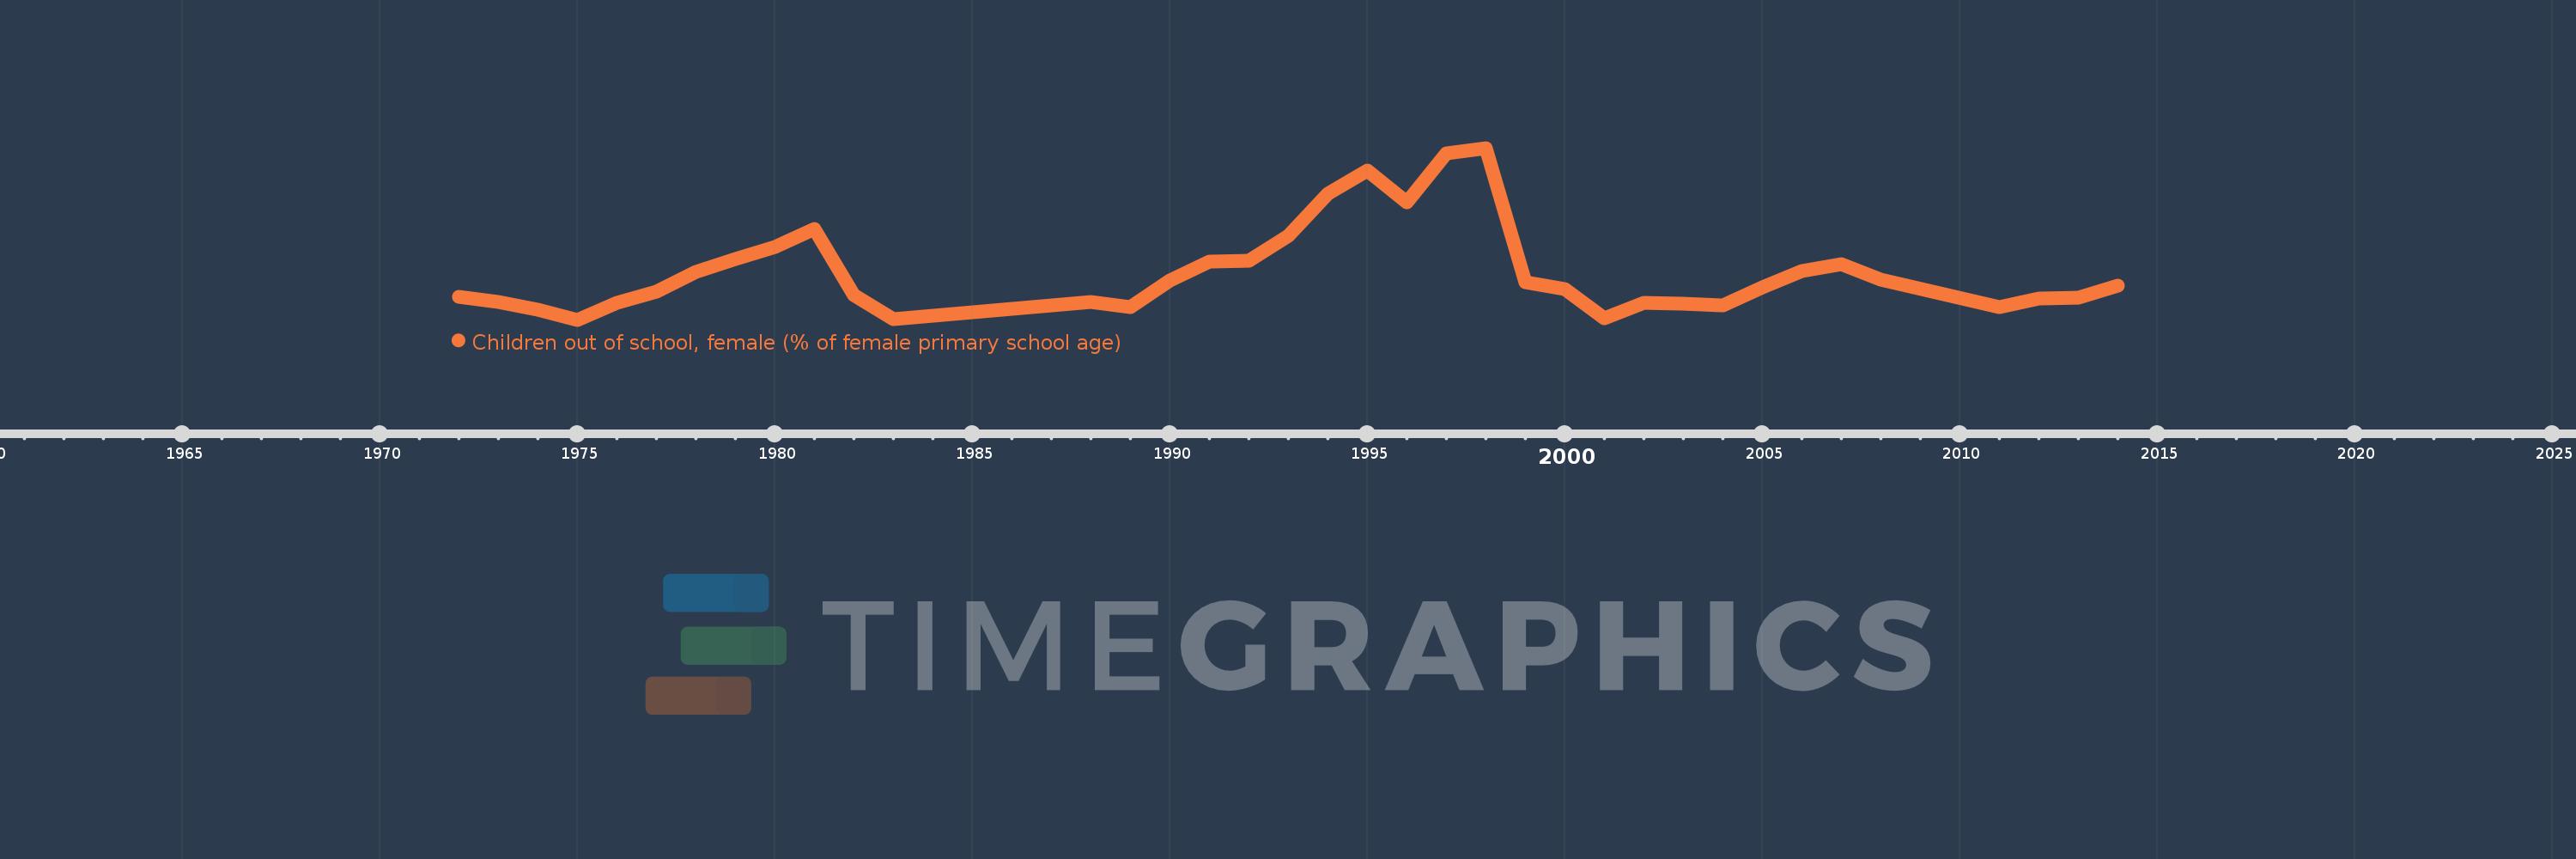
Children out of school, female (% of female primary school age)
2014,2013,2012,2011,2008,2007,2006,2005,2004,2003,2002,2001,2000,1999,1998,1997,1996,1995,1994,1993,1992,1991,1990,1989,1988,1983,1982,1981,1980,1979,1978,1977,1976,1975,1974,1973,1972
Estas estadísticas en otros países:
AfghanistanAlbaniaAlgeriaAngolaAntigua and BarbudaArab WorldArgentinaArmeniaArubaAustraliaAustriaAzerbaijanBahamas, TheBahrainBangladeshBarbadosBelarusBelgiumBelizeBeninBermudaBhutanBoliviaBosnia and HerzegovinaBotswanaBrazilBrunei DarussalamBulgariaBurkina FasoBurundiCabo VerdeCambodiaCameroonCanadaCaribbean small statesCentral African RepublicCentral Europe and the BalticsChadChileChinaColombiaComorosCongo, Dem. Rep.Congo, Rep.Costa RicaCote d'IvoireCroatiaCubaCyprusDenmarkDjiboutiDominicaDominican RepublicEarly-demographic dividendEast Asia & PacificEast Asia & Pacific (excluding high income)East Asia & Pacific (IDA & IBRD countries)EcuadorEgypt, Arab Rep.El SalvadorEquatorial GuineaEritreaEstoniaEthiopiaEuro areaEurope & Central AsiaEurope & Central Asia (excluding high income)Europe & Central Asia (IDA & IBRD countries)European UnionFijiFinlandFragile and conflict affected situationsFranceGabonGambia, TheGeorgiaGhanaGreeceGrenadaGuatemalaGuineaGuinea-BissauGuyanaHaitiHeavily indebted poor countries (HIPC)High incomeHondurasHong Kong SAR, ChinaHungaryIBRD onlyIcelandIDA & IBRD totalIDA blendIDA onlyIDA totalIndiaIndonesiaIran, Islamic Rep.IraqIrelandIsraelItalyJamaicaJapanJordanKazakhstanKenyaKiribatiKorea, Dem. People’s Rep.Korea, Rep.KuwaitKyrgyz RepublicLao PDRLate-demographic dividendLatin America & Caribbean Latin America & Caribbean (excluding high income)Latin America & the Caribbean (IDA & IBRD countries)LatviaLeast developed countries: UN classificationLebanonLesothoLiberiaLibyaLiechtensteinLithuaniaLow & middle incomeLow incomeLower middle incomeLuxembourgMacao SAR, ChinaMacedonia, FYRMadagascarMalawiMaldivesMaliMaltaMarshall IslandsMauritaniaMauritiusMexicoMicronesia, Fed. Sts.Middle East & North AfricaMiddle East & North Africa (excluding high income)Middle East & North Africa (IDA & IBRD countries)Middle incomeMoldovaMongoliaMontenegroMoroccoMozambiqueMyanmarNamibiaNauruNepalNetherlandsNew ZealandNicaraguaNigerNigeriaNorth AmericaNorwayOECD membersOmanOther small statesPacific island small statesPakistanPanamaPapua New GuineaParaguayPeruPhilippinesPolandPortugalPost-demographic dividendPre-demographic dividendPuerto RicoQatarRomaniaRussian FederationRwandaSamoaSan MarinoSao Tome and PrincipeSaudi ArabiaSenegalSerbiaSeychellesSierra LeoneSloveniaSmall statesSolomon IslandsSomaliaSouth AfricaSouth AsiaSouth Asia (IDA & IBRD)South SudanSpainSri LankaSt. Kitts and NevisSt. LuciaSt. Vincent and the GrenadinesSub-Saharan Africa Sub-Saharan Africa (excluding high income)Sub-Saharan Africa (IDA & IBRD countries)SudanSurinameSwazilandSwedenSwitzerlandSyrian Arab RepublicTajikistanTanzaniaThailandTimor-LesteTogoTongaTrinidad and TobagoTunisiaTurkeyTuvaluUgandaUkraineUnited Arab EmiratesUnited KingdomUnited StatesUpper middle incomeUruguayUzbekistanVanuatuVenezuela, RBWest Bank and GazaWorldYemen, Rep.ZambiaZimbabwe línea de tiempo (timeline):
En esta escala de tiempo se presenta un gráfico de 1972 y 2014 de Greece. Los datos de 1971 están ausentes. El número de observaciones reales por fecha: 37.
Fuente (nombre):
Indicadores del desarrollo mundial
Fuente (organización):
United Nations Educational, Scientific, and Cultural Organization (UNESCO) Institute for Statistics.
Categorías:
Education
Se ha actualizado:
23 abr 2017 año
Los indicadores de los cambios de valor en los últimos años
Mínimo:
1.611
1 ene 1975 año
Máximo:
9.922
1 ene 1998 año
A la fecha de observación
Valor
Cambio absoluto
El cambio con respecto al valor anterior
1 ene 1972 año
2.731
+2.731
0.0%
1 ene 1973 año
2.49
-0.241
-8.82%
1 ene 1974 año
2.091
-0.399
-16.01%
1 ene 1975 año
1.611
-0.481
-22.98%
1 ene 1976 año
2.42
+0.809
50.23%
1 ene 1977 año
2.99
+0.57
23.56%
1 ene 1978 año
3.916
+0.926
30.98%
1 ene 1979 año
4.558
+0.642
16.38%
1 ene 1980 año
5.121
+0.563
12.36%
1 ene 1981 año
6.01
+0.89
17.37%
1 ene 1982 año
2.792
-3.218
-53.54%
1 ene 1983 año
1.639
-1.154
-41.32%
1 ene 1988 año
2.477
+0.839
51.19%
1 ene 1989 año
2.23
-0.247
-9.97%
1 ene 1990 año
3.504
+1.274
57.12%
1 ene 1991 año
4.421
+0.917
26.15%
1 ene 1992 año
4.486
+0.065
1.48%
1 ene 1993 año
5.655
+1.169
26.05%
1 ene 1994 año
7.714
+2.059
36.4%
1 ene 1995 año
8.813
+1.099
14.25%
1 ene 1996 año
7.28
-1.532
-17.39%
1 ene 1997 año
9.673
+2.393
32.88%
1 ene 1998 año
9.922
+0.249
2.57%
1 ene 1999 año
3.437
-6.485
-65.36%
1 ene 2000 año
3.075
-0.362
-10.52%
1 ene 2001 año
1.675
-1.4
-45.53%
1 ene 2002 año
2.426
+0.751
44.85%
1 ene 2003 año
2.395
-0.032
-1.31%
1 ene 2004 año
2.314
-0.081
-3.38%
1 ene 2005 año
3.171
+0.858
37.06%
1 ene 2006 año
3.95
+0.779
24.57%
1 ene 2007 año
4.297
+0.347
8.79%
1 ene 2008 año
3.568
-0.729
-16.97%
1 ene 2011 año
2.208
-1.36
-38.12%
1 ene 2012 año
2.654
+0.446
20.2%
1 ene 2013 año
2.678
+0.025
0.93%
1 ene 2014 año
3.281
+0.603
22.52%
Ranking de los países por los datos estadísticos actuales


Comentarios: