29
/es/
es
AIzaSyAYiBZKx7MnpbEhh9jyipgxe19OcubqV5w
April 1, 2024
31579
Europe & Central Asia (excluding high income)
ECA
false
2
1
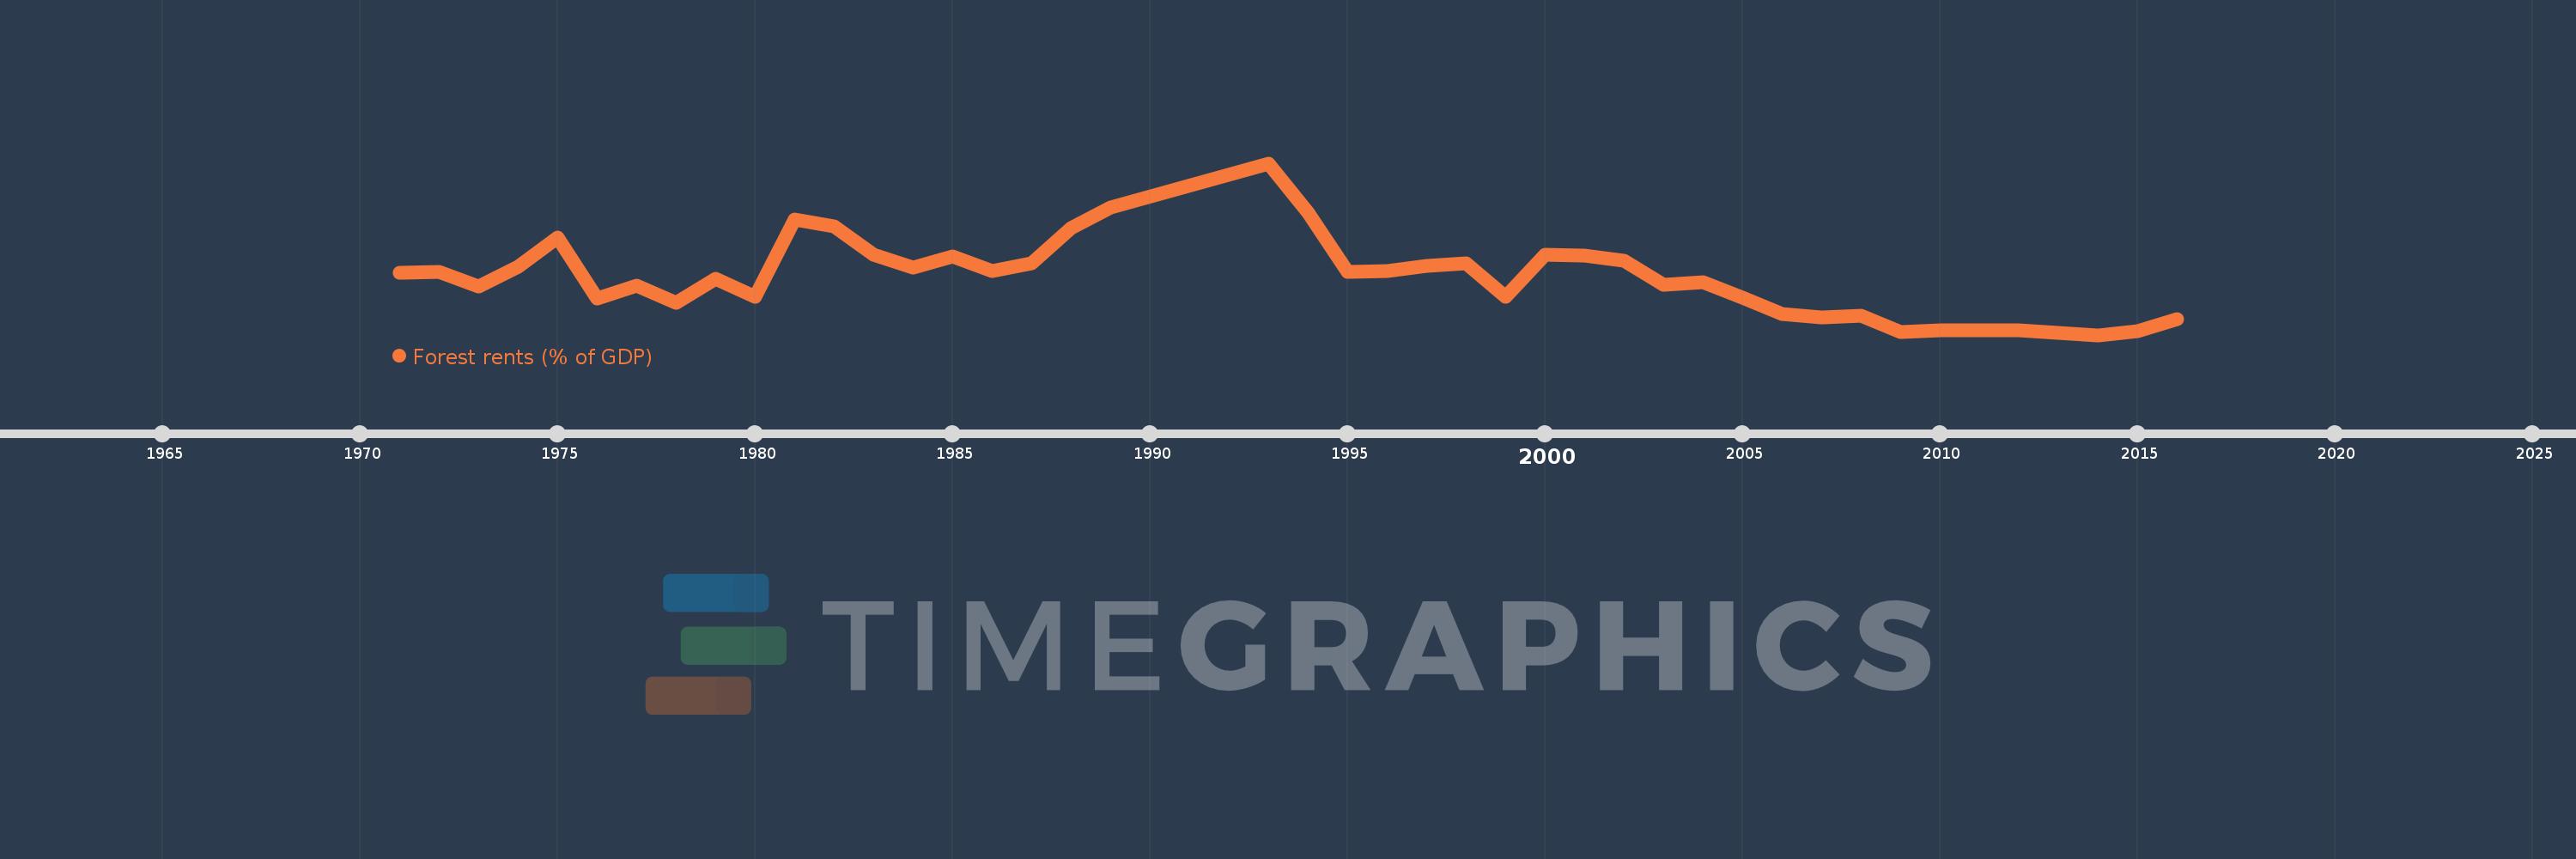
Forest rents (% of GDP)
2016,2015,2014,2013,2012,2011,2010,2009,2008,2007,2006,2005,2004,2003,2002,2001,2000,1999,1998,1997,1996,1995,1994,1993,1989,1988,1987,1986,1985,1984,1983,1982,1981,1980,1979,1978,1977,1976,1975,1974,1973,1972,1971
Estas estadísticas en otros países:
AfghanistanAlbaniaAlgeriaAndorraAngolaArab WorldArgentinaArmeniaArubaAustraliaAustriaAzerbaijanBahamas, TheBahrainBangladeshBarbadosBelarusBelgiumBelizeBeninBhutanBoliviaBosnia and HerzegovinaBotswanaBrazilBrunei DarussalamBulgariaBurkina FasoBurundiCabo VerdeCambodiaCameroonCanadaCaribbean small statesCentral African RepublicCentral Europe and the BalticsChadChileChinaColombiaComorosCongo, Dem. Rep.Congo, Rep.Costa RicaCote d'IvoireCroatiaCubaCyprusCzech RepublicDenmarkDjiboutiDominicaDominican RepublicEarly-demographic dividendEast Asia & PacificEast Asia & Pacific (excluding high income)East Asia & Pacific (IDA & IBRD countries)EcuadorEgypt, Arab Rep.El SalvadorEquatorial GuineaEritreaEstoniaEthiopiaEuro areaEurope & Central AsiaEurope & Central Asia (excluding high income)Europe & Central Asia (IDA & IBRD countries)European UnionFaroe IslandsFijiFinlandFragile and conflict affected situationsFranceFrench PolynesiaGabonGambia, TheGeorgiaGermanyGhanaGreeceGuatemalaGuineaGuinea-BissauGuyanaHaitiHeavily indebted poor countries (HIPC)High incomeHondurasHong Kong SAR, ChinaHungaryIBRD onlyIcelandIDA & IBRD totalIDA blendIDA onlyIDA totalIndiaIndonesiaIran, Islamic Rep.IraqIrelandIsraelItalyJamaicaJapanJordanKazakhstanKenyaKiribatiKorea, Rep.KuwaitKyrgyz RepublicLao PDRLate-demographic dividendLatin America & Caribbean Latin America & Caribbean (excluding high income)Latin America & the Caribbean (IDA & IBRD countries)LatviaLeast developed countries: UN classificationLebanonLesothoLiberiaLibyaLiechtensteinLithuaniaLow & middle incomeLow incomeLower middle incomeLuxembourgMacao SAR, ChinaMacedonia, FYRMadagascarMalawiMalaysiaMaldivesMaliMaltaMauritaniaMauritiusMexicoMicronesia, Fed. Sts.Middle East & North AfricaMiddle East & North Africa (excluding high income)Middle East & North Africa (IDA & IBRD countries)Middle incomeMoldovaMongoliaMontenegroMoroccoMozambiqueMyanmarNamibiaNepalNetherlandsNew CaledoniaNew ZealandNicaraguaNigerNigeriaNorth AmericaNorwayOECD membersOmanOther small statesPacific island small statesPakistanPanamaPapua New GuineaParaguayPeruPhilippinesPolandPortugalPost-demographic dividendPre-demographic dividendQatarRomaniaRussian FederationRwandaSamoaSao Tome and PrincipeSaudi ArabiaSenegalSerbiaSeychellesSierra LeoneSingaporeSlovak RepublicSloveniaSmall statesSolomon IslandsSomaliaSouth AfricaSouth AsiaSouth Asia (IDA & IBRD)South SudanSpainSri LankaSt. LuciaSt. Vincent and the GrenadinesSub-Saharan Africa Sub-Saharan Africa (excluding high income)Sub-Saharan Africa (IDA & IBRD countries)SudanSurinameSwazilandSwedenSwitzerlandSyrian Arab RepublicTajikistanTanzaniaThailandTimor-LesteTogoTongaTrinidad and TobagoTunisiaTurkeyTurkmenistanUgandaUkraineUnited Arab EmiratesUnited KingdomUnited StatesUpper middle incomeUruguayUzbekistanVanuatuVenezuela, RBVietnamWorldYemen, Rep.ZambiaZimbabwe línea de tiempo (timeline):
En esta escala de tiempo se presenta un gráfico de 1971 y 2016 de Europe & Central Asia (excluding high income). Los datos de 1970 están ausentes. El número de observaciones reales por fecha: 43.
Fuente (nombre):
Indicadores del desarrollo mundial
Fuente (organización):
Estimates based on sources and methods described in "The Changing Wealth of Nations: Measuring Sustainable Development in the New Millennium" (World Bank, 2011).
Categorías:
Environment
Se ha actualizado:
23 abr 2017 año
Los indicadores de los cambios de valor en los últimos años
Mínimo:
0.184
1 ene 2014 año
Máximo:
0.762
1 ene 1993 año
A la fecha de observación
Valor
Cambio absoluto
El cambio con respecto al valor anterior
1 ene 1971 año
0.393
+0.393
0.0%
1 ene 1972 año
0.396
+0.003
0.77%
1 ene 1973 año
0.347
-0.049
-12.31%
1 ene 1974 año
0.414
+0.066
19.13%
1 ene 1975 año
0.512
+0.099
23.9%
1 ene 1976 año
0.306
-0.207
-40.35%
1 ene 1977 año
0.35
+0.044
14.35%
1 ene 1978 año
0.292
-0.057
-16.34%
1 ene 1979 año
0.372
+0.08
27.3%
1 ene 1980 año
0.314
-0.058
-15.71%
1 ene 1981 año
0.573
+0.259
82.63%
1 ene 1982 año
0.55
-0.023
-3.98%
1 ene 1983 año
0.455
-0.096
-17.36%
1 ene 1984 año
0.41
-0.045
-9.9%
1 ene 1985 año
0.448
+0.038
9.3%
1 ene 1986 año
0.399
-0.049
-10.87%
1 ene 1987 año
0.424
+0.025
6.3%
1 ene 1988 año
0.544
+0.12
28.24%
1 ene 1989 año
0.613
+0.069
12.64%
1 ene 1993 año
0.762
+0.149
24.32%
1 ene 1994 año
0.596
-0.166
-21.77%
1 ene 1995 año
0.396
-0.2
-33.6%
1 ene 1996 año
0.398
+0.002
0.45%
1 ene 1997 año
0.417
+0.02
4.92%
1 ene 1998 año
0.424
+0.007
1.69%
1 ene 1999 año
0.313
-0.111
-26.19%
1 ene 2000 año
0.455
+0.142
45.23%
1 ene 2001 año
0.452
-0.002
-0.48%
1 ene 2002 año
0.435
-0.018
-3.94%
1 ene 2003 año
0.353
-0.082
-18.83%
1 ene 2004 año
0.362
+0.009
2.65%
1 ene 2005 año
0.31
-0.052
-14.44%
1 ene 2006 año
0.254
-0.056
-18.13%
1 ene 2007 año
0.243
-0.011
-4.16%
1 ene 2008 año
0.248
+0.005
2.1%
1 ene 2009 año
0.193
-0.056
-22.45%
1 ene 2010 año
0.2
+0.007
3.72%
1 ene 2011 año
0.199
0.0
-0.12%
1 ene 2012 año
0.201
+0.002
0.88%
1 ene 2013 año
0.19
-0.011
-5.35%
1 ene 2014 año
0.184
-0.007
-3.62%
1 ene 2015 año
0.196
+0.012
6.73%
1 ene 2016 año
0.237
+0.041
20.97%
Ranking de los países por los datos estadísticos actuales


Comentarios: