29
/es/
es
AIzaSyAYiBZKx7MnpbEhh9jyipgxe19OcubqV5w
April 1, 2024
177668
Lesotho
LSO
true
2
1
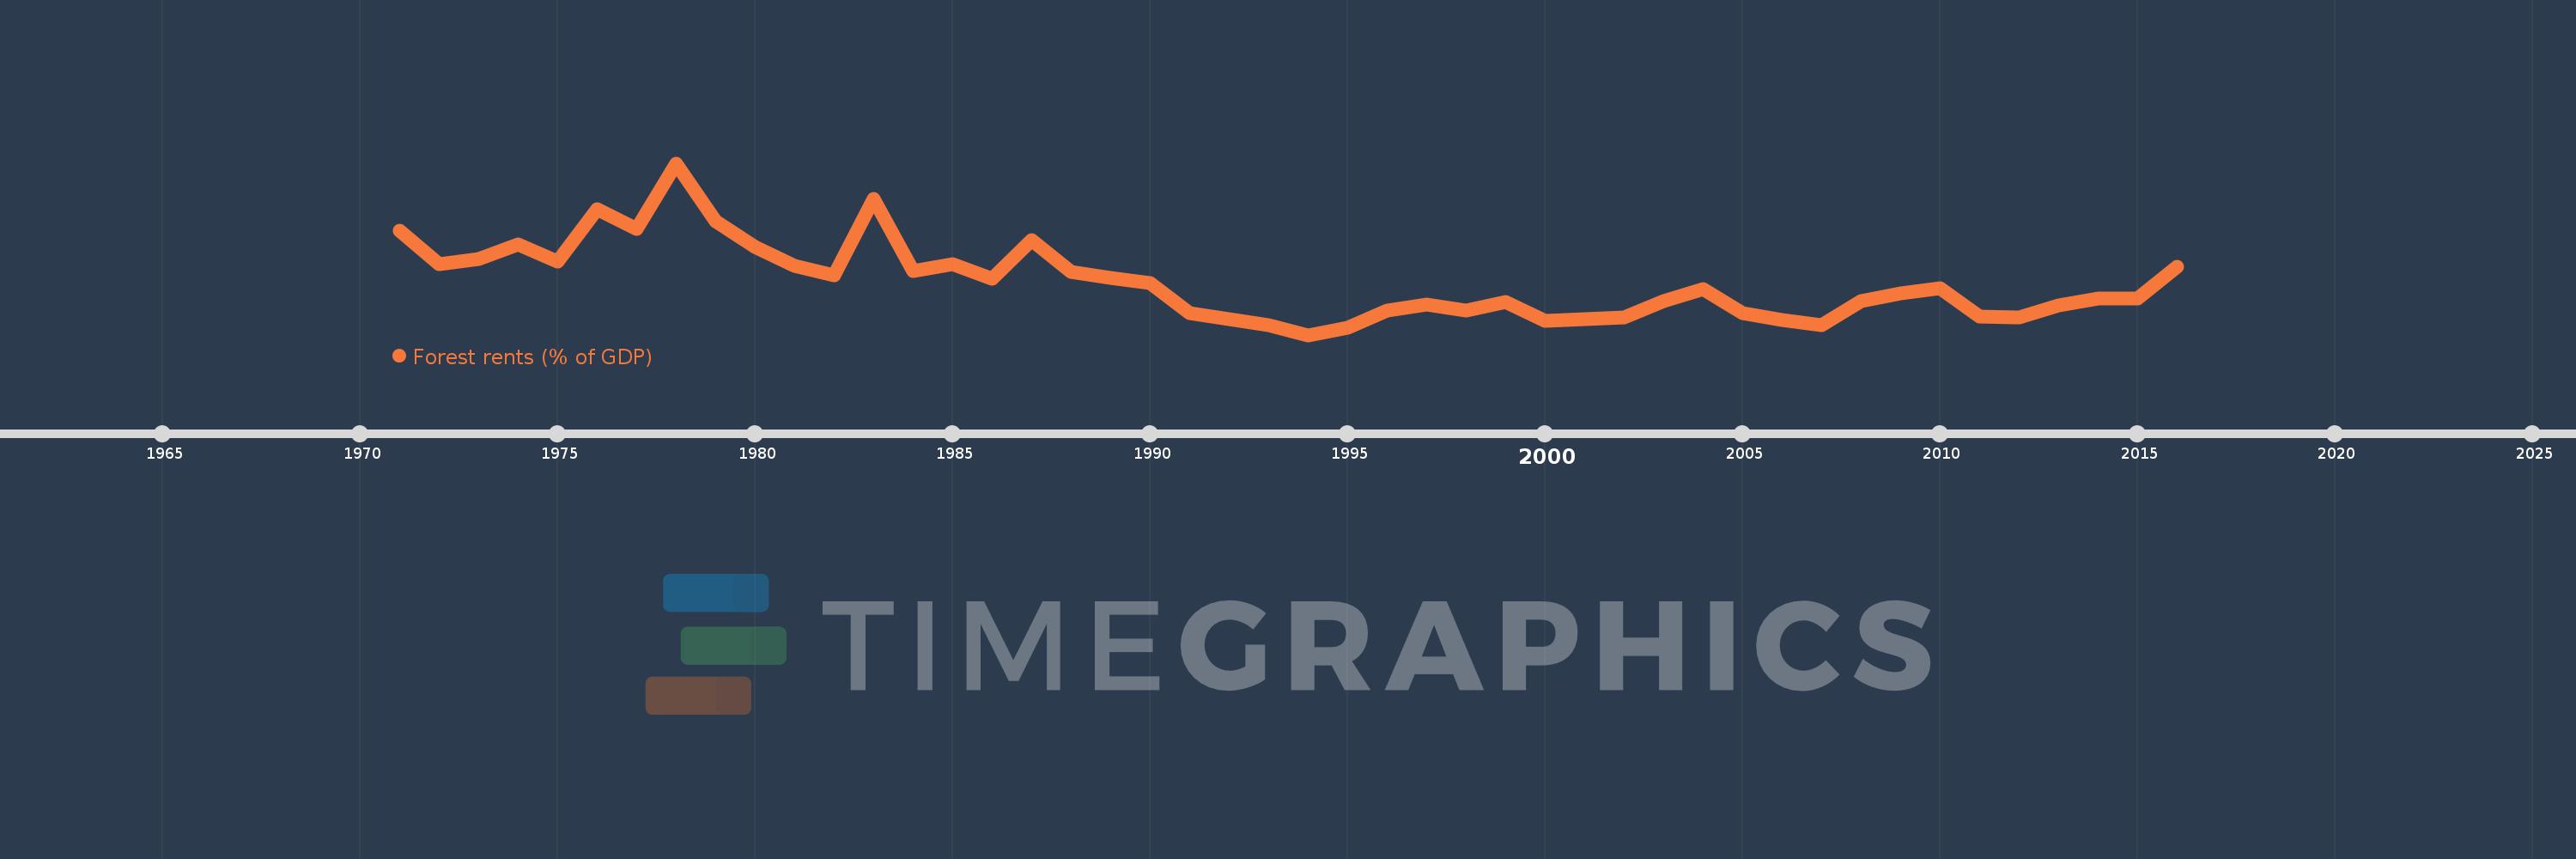
Forest rents (% of GDP)
2016,2015,2014,2013,2012,2011,2010,2009,2008,2007,2006,2005,2004,2003,2002,2001,2000,1999,1998,1997,1996,1995,1994,1993,1992,1991,1990,1989,1988,1987,1986,1985,1984,1983,1982,1981,1980,1979,1978,1977,1976,1975,1974,1973,1972,1971
Estas estadísticas en otros países:
AfghanistanAlbaniaAlgeriaAndorraAngolaArab WorldArgentinaArmeniaArubaAustraliaAustriaAzerbaijanBahamas, TheBahrainBangladeshBarbadosBelarusBelgiumBelizeBeninBhutanBoliviaBosnia and HerzegovinaBotswanaBrazilBrunei DarussalamBulgariaBurkina FasoBurundiCabo VerdeCambodiaCameroonCanadaCaribbean small statesCentral African RepublicCentral Europe and the BalticsChadChileChinaColombiaComorosCongo, Dem. Rep.Congo, Rep.Costa RicaCote d'IvoireCroatiaCubaCyprusCzech RepublicDenmarkDjiboutiDominicaDominican RepublicEarly-demographic dividendEast Asia & PacificEast Asia & Pacific (excluding high income)East Asia & Pacific (IDA & IBRD countries)EcuadorEgypt, Arab Rep.El SalvadorEquatorial GuineaEritreaEstoniaEthiopiaEuro areaEurope & Central AsiaEurope & Central Asia (excluding high income)Europe & Central Asia (IDA & IBRD countries)European UnionFaroe IslandsFijiFinlandFragile and conflict affected situationsFranceFrench PolynesiaGabonGambia, TheGeorgiaGermanyGhanaGreeceGuatemalaGuineaGuinea-BissauGuyanaHaitiHeavily indebted poor countries (HIPC)High incomeHondurasHong Kong SAR, ChinaHungaryIBRD onlyIcelandIDA & IBRD totalIDA blendIDA onlyIDA totalIndiaIndonesiaIran, Islamic Rep.IraqIrelandIsraelItalyJamaicaJapanJordanKazakhstanKenyaKiribatiKorea, Rep.KuwaitKyrgyz RepublicLao PDRLate-demographic dividendLatin America & Caribbean Latin America & Caribbean (excluding high income)Latin America & the Caribbean (IDA & IBRD countries)LatviaLeast developed countries: UN classificationLebanonLesothoLiberiaLibyaLiechtensteinLithuaniaLow & middle incomeLow incomeLower middle incomeLuxembourgMacao SAR, ChinaMacedonia, FYRMadagascarMalawiMalaysiaMaldivesMaliMaltaMauritaniaMauritiusMexicoMicronesia, Fed. Sts.Middle East & North AfricaMiddle East & North Africa (excluding high income)Middle East & North Africa (IDA & IBRD countries)Middle incomeMoldovaMongoliaMontenegroMoroccoMozambiqueMyanmarNamibiaNepalNetherlandsNew CaledoniaNew ZealandNicaraguaNigerNigeriaNorth AmericaNorwayOECD membersOmanOther small statesPacific island small statesPakistanPanamaPapua New GuineaParaguayPeruPhilippinesPolandPortugalPost-demographic dividendPre-demographic dividendQatarRomaniaRussian FederationRwandaSamoaSao Tome and PrincipeSaudi ArabiaSenegalSerbiaSeychellesSierra LeoneSingaporeSlovak RepublicSloveniaSmall statesSolomon IslandsSomaliaSouth AfricaSouth AsiaSouth Asia (IDA & IBRD)South SudanSpainSri LankaSt. LuciaSt. Vincent and the GrenadinesSub-Saharan Africa Sub-Saharan Africa (excluding high income)Sub-Saharan Africa (IDA & IBRD countries)SudanSurinameSwazilandSwedenSwitzerlandSyrian Arab RepublicTajikistanTanzaniaThailandTimor-LesteTogoTongaTrinidad and TobagoTunisiaTurkeyTurkmenistanUgandaUkraineUnited Arab EmiratesUnited KingdomUnited StatesUpper middle incomeUruguayUzbekistanVanuatuVenezuela, RBVietnamWorldYemen, Rep.ZambiaZimbabwe línea de tiempo (timeline):
En esta escala de tiempo se presenta un gráfico de 1971 y 2016 de Lesotho. Los datos de 1970 están ausentes. El número de observaciones reales por fecha: 46.
Fuente (nombre):
Indicadores del desarrollo mundial
Fuente (organización):
Estimates based on sources and methods described in "The Changing Wealth of Nations: Measuring Sustainable Development in the New Millennium" (World Bank, 2011).
Categorías:
Environment
Se ha actualizado:
23 abr 2017 año
Los indicadores de los cambios de valor en los últimos años
Mínimo:
2.447
1 ene 1994 año
Máximo:
13.656
1 ene 1978 año
A la fecha de observación
Valor
Cambio absoluto
El cambio con respecto al valor anterior
1 ene 1971 año
9.264
+9.264
0.0%
1 ene 1972 año
7.053
-2.211
-23.87%
1 ene 1973 año
7.425
+0.372
5.27%
1 ene 1974 año
8.337
+0.912
12.29%
1 ene 1975 año
7.236
-1.101
-13.21%
1 ene 1976 año
10.646
+3.41
47.13%
1 ene 1977 año
9.385
-1.261
-11.85%
1 ene 1978 año
13.656
+4.271
45.51%
1 ene 1979 año
9.879
-3.777
-27.66%
1 ene 1980 año
8.201
-1.679
-16.99%
1 ene 1981 año
6.976
-1.224
-14.93%
1 ene 1982 año
6.316
-0.66
-9.46%
1 ene 1983 año
11.33
+5.014
79.38%
1 ene 1984 año
6.614
-4.716
-41.63%
1 ene 1985 año
7.055
+0.441
6.67%
1 ene 1986 año
6.132
-0.922
-13.07%
1 ene 1987 año
8.636
+2.503
40.82%
1 ene 1988 año
6.564
-2.072
-23.99%
1 ene 1989 año
6.183
-0.381
-5.8%
1 ene 1990 año
5.857
-0.326
-5.27%
1 ene 1991 año
3.899
-1.958
-33.43%
1 ene 1992 año
3.502
-0.397
-10.19%
1 ene 1993 año
3.079
-0.422
-12.06%
1 ene 1994 año
2.447
-0.632
-20.53%
1 ene 1995 año
2.923
+0.476
19.44%
1 ene 1996 año
4.067
+1.145
39.16%
1 ene 1997 año
4.429
+0.361
8.88%
1 ene 1998 año
4.031
-0.398
-8.98%
1 ene 1999 año
4.628
+0.597
14.8%
1 ene 2000 año
3.373
-1.255
-27.12%
1 ene 2001 año
3.459
+0.086
2.56%
1 ene 2002 año
3.613
+0.154
4.46%
1 ene 2003 año
4.65
+1.037
28.7%
1 ene 2004 año
5.468
+0.818
17.6%
1 ene 2005 año
3.855
-1.613
-29.5%
1 ene 2006 año
3.426
-0.429
-11.13%
1 ene 2007 año
3.068
-0.358
-10.44%
1 ene 2008 año
4.656
+1.587
51.73%
1 ene 2009 año
5.142
+0.486
10.44%
1 ene 2010 año
5.495
+0.354
6.88%
1 ene 2011 año
3.675
-1.82
-33.12%
1 ene 2012 año
3.589
-0.087
-2.36%
1 ene 2013 año
4.37
+0.782
21.78%
1 ene 2014 año
4.826
+0.456
10.43%
1 ene 2015 año
4.843
+0.017
0.35%
1 ene 2016 año
6.927
+2.085
43.05%
Ranking de los países por los datos estadísticos actuales


Comentarios: