29
/es/
es
AIzaSyAYiBZKx7MnpbEhh9jyipgxe19OcubqV5w
April 1, 2024
284735
Yemen, Rep.
YEM
true
2
1
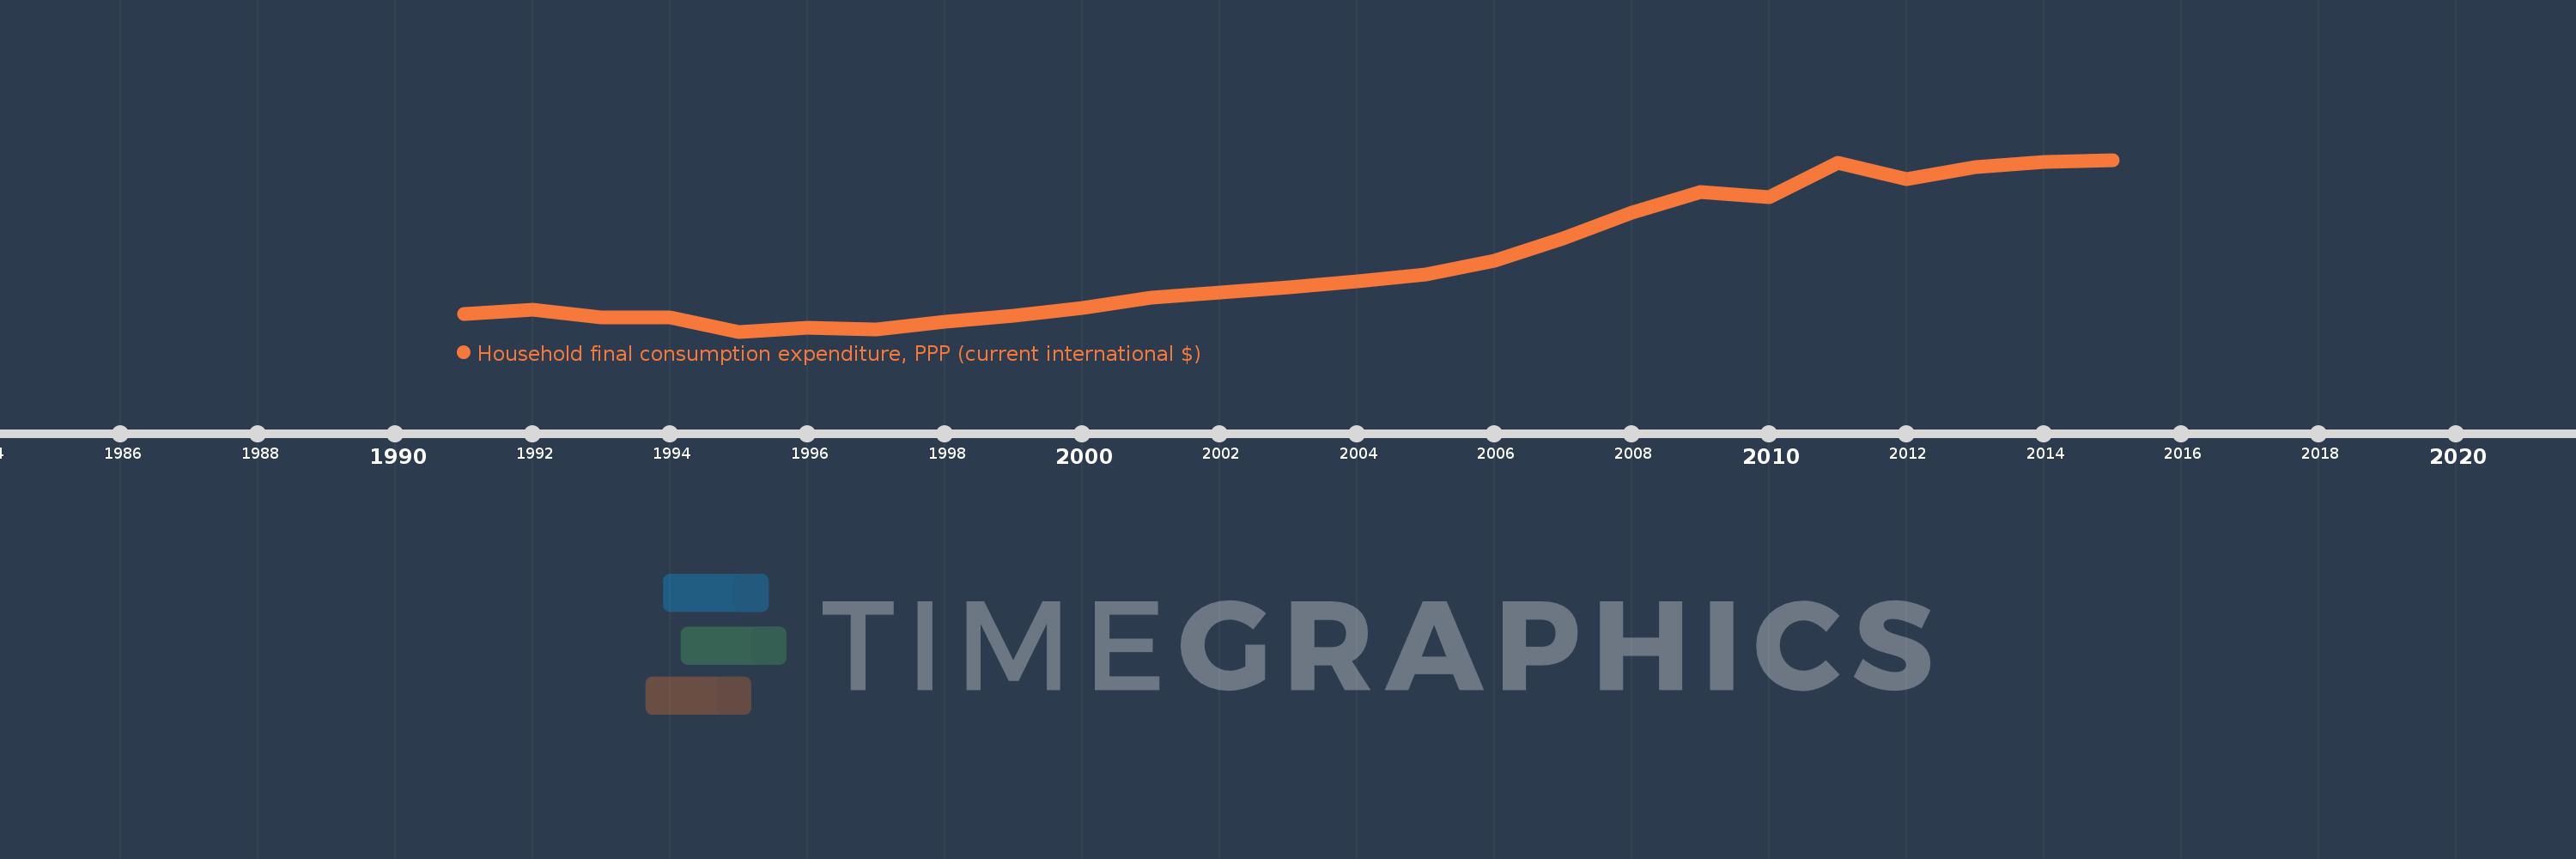
Household final consumption expenditure, PPP (current international $)
2015,2014,2013,2012,2011,2010,2009,2008,2007,2006,2005,2004,2003,2002,2001,2000,1999,1998,1997,1996,1995,1994,1993,1992,1991
Estas estadísticas en otros países:
AfghanistanAlbaniaAlgeriaAngolaAntigua and BarbudaArab WorldArgentinaArmeniaArubaAustraliaAustriaAzerbaijanBahamas, TheBahrainBangladeshBarbadosBelarusBelgiumBelizeBeninBermudaBhutanBoliviaBosnia and HerzegovinaBotswanaBrazilBrunei DarussalamBulgariaBurkina FasoBurundiCabo VerdeCambodiaCameroonCanadaCaribbean small statesCentral African RepublicCentral Europe and the BalticsChadChileChinaColombiaComorosCongo, Dem. Rep.Congo, Rep.Costa RicaCote d'IvoireCroatiaCubaCyprusCzech RepublicDenmarkDjiboutiDominicaDominican RepublicEarly-demographic dividendEast Asia & PacificEast Asia & Pacific (excluding high income)East Asia & Pacific (IDA & IBRD countries)EcuadorEgypt, Arab Rep.El SalvadorEquatorial GuineaEritreaEstoniaEthiopiaEuro areaEurope & Central AsiaEurope & Central Asia (excluding high income)Europe & Central Asia (IDA & IBRD countries)European UnionFijiFinlandFranceGabonGambia, TheGeorgiaGermanyGhanaGreeceGrenadaGuatemalaGuineaGuinea-BissauGuyanaHaitiHeavily indebted poor countries (HIPC)High incomeHondurasHong Kong SAR, ChinaHungaryIBRD onlyIcelandIDA & IBRD totalIDA blendIDA onlyIDA totalIndiaIndonesiaIran, Islamic Rep.IrelandIsraelItalyJamaicaJapanJordanKazakhstanKenyaKorea, Rep.KosovoKuwaitKyrgyz RepublicLao PDRLate-demographic dividendLatin America & Caribbean Latin America & Caribbean (excluding high income)Latin America & the Caribbean (IDA & IBRD countries)LatviaLeast developed countries: UN classificationLebanonLiberiaLibyaLithuaniaLow & middle incomeLow incomeLower middle incomeLuxembourgMacao SAR, ChinaMacedonia, FYRMadagascarMalawiMalaysiaMaliMaltaMauritaniaMauritiusMexicoMiddle East & North AfricaMiddle East & North Africa (excluding high income)Middle East & North Africa (IDA & IBRD countries)Middle incomeMoldovaMongoliaMontenegroMoroccoMozambiqueNamibiaNepalNetherlandsNew ZealandNicaraguaNigerNigeriaNorth AmericaNorwayOECD membersOmanOther small statesPakistanPanamaPapua New GuineaParaguayPeruPhilippinesPolandPortugalPost-demographic dividendPre-demographic dividendPuerto RicoQatarRomaniaRussian FederationRwandaSaudi ArabiaSenegalSerbiaSeychellesSierra LeoneSingaporeSlovak RepublicSloveniaSmall statesSolomon IslandsSouth AfricaSouth AsiaSouth Asia (IDA & IBRD)South SudanSpainSri LankaSt. Kitts and NevisSt. LuciaSt. Vincent and the GrenadinesSub-Saharan Africa Sub-Saharan Africa (excluding high income)Sub-Saharan Africa (IDA & IBRD countries)SudanSurinameSwazilandSwedenSwitzerlandSyrian Arab RepublicTajikistanTanzaniaThailandTimor-LesteTogoTongaTrinidad and TobagoTunisiaTurkeyTurkmenistanUgandaUkraineUnited Arab EmiratesUnited KingdomUnited StatesUpper middle incomeUruguayUzbekistanVanuatuVenezuela, RBVietnamWest Bank and GazaWorldYemen, Rep.ZambiaZimbabwe línea de tiempo (timeline):
En esta escala de tiempo se presenta un gráfico de 1991 y 2015 de Yemen, Rep.. Los datos de 1990 están ausentes. El número de observaciones reales por fecha: 25.
Fuente (nombre):
Indicadores del desarrollo mundial
Fuente (organización):
World Bank, International Comparison Program database.
Categorías:
Economy & Growth
Se ha actualizado:
23 abr 2017 año
Los indicadores de los cambios de valor en los últimos años
Mínimo:
18.837 bn
1 ene 1995 año
Máximo:
78.463 bn
1 ene 2015 año
A la fecha de observación
Valor
Cambio absoluto
El cambio con respecto al valor anterior
1 ene 1991 año
25.054 bn
+25.054 bn
0.0%
1 ene 1992 año
26.345 bn
+1.291 bn
5.15%
1 ene 1993 año
23.767 bn
-2.578 bn
-9.79%
1 ene 1994 año
23.791 bn
+24.401 millones
0.1%
1 ene 1995 año
18.837 bn
-4.953 bn
-20.82%
1 ene 1996 año
20.032 bn
+1.195 bn
6.34%
1 ene 1997 año
19.445 bn
-586.831 millones
-2.93%
1 ene 1998 año
22.177 bn
+2.731 bn
14.05%
1 ene 1999 año
24.269 bn
+2.092 bn
9.44%
1 ene 2000 año
26.977 bn
+2.708 bn
11.16%
1 ene 2001 año
30.597 bn
+3.62 bn
13.42%
1 ene 2002 año
32.516 bn
+1.92 bn
6.27%
1 ene 2003 año
34.27 bn
+1.753 bn
5.39%
1 ene 2004 año
36.196 bn
+1.926 bn
5.62%
1 ene 2005 año
38.715 bn
+2.519 bn
6.96%
1 ene 2006 año
43.4 bn
+4.685 bn
12.1%
1 ene 2007 año
51.243 bn
+7.843 bn
18.07%
1 ene 2008 año
60.104 bn
+8.862 bn
17.29%
1 ene 2009 año
67.29 bn
+7.185 bn
11.95%
1 ene 2010 año
65.437 bn
-1.853 bn
-2.75%
1 ene 2011 año
77.489 bn
+12.052 bn
18.42%
1 ene 2012 año
71.661 bn
-5.828 bn
-7.52%
1 ene 2013 año
75.941 bn
+4.279 bn
5.97%
1 ene 2014 año
77.807 bn
+1.866 bn
2.46%
1 ene 2015 año
78.463 bn
+656.688 millones
0.84%
Ranking de los países por los datos estadísticos actuales


Comentarios: