29
/es/
es
AIzaSyAYiBZKx7MnpbEhh9jyipgxe19OcubqV5w
April 1, 2024
253127
Sudan
SDN
true
2
1
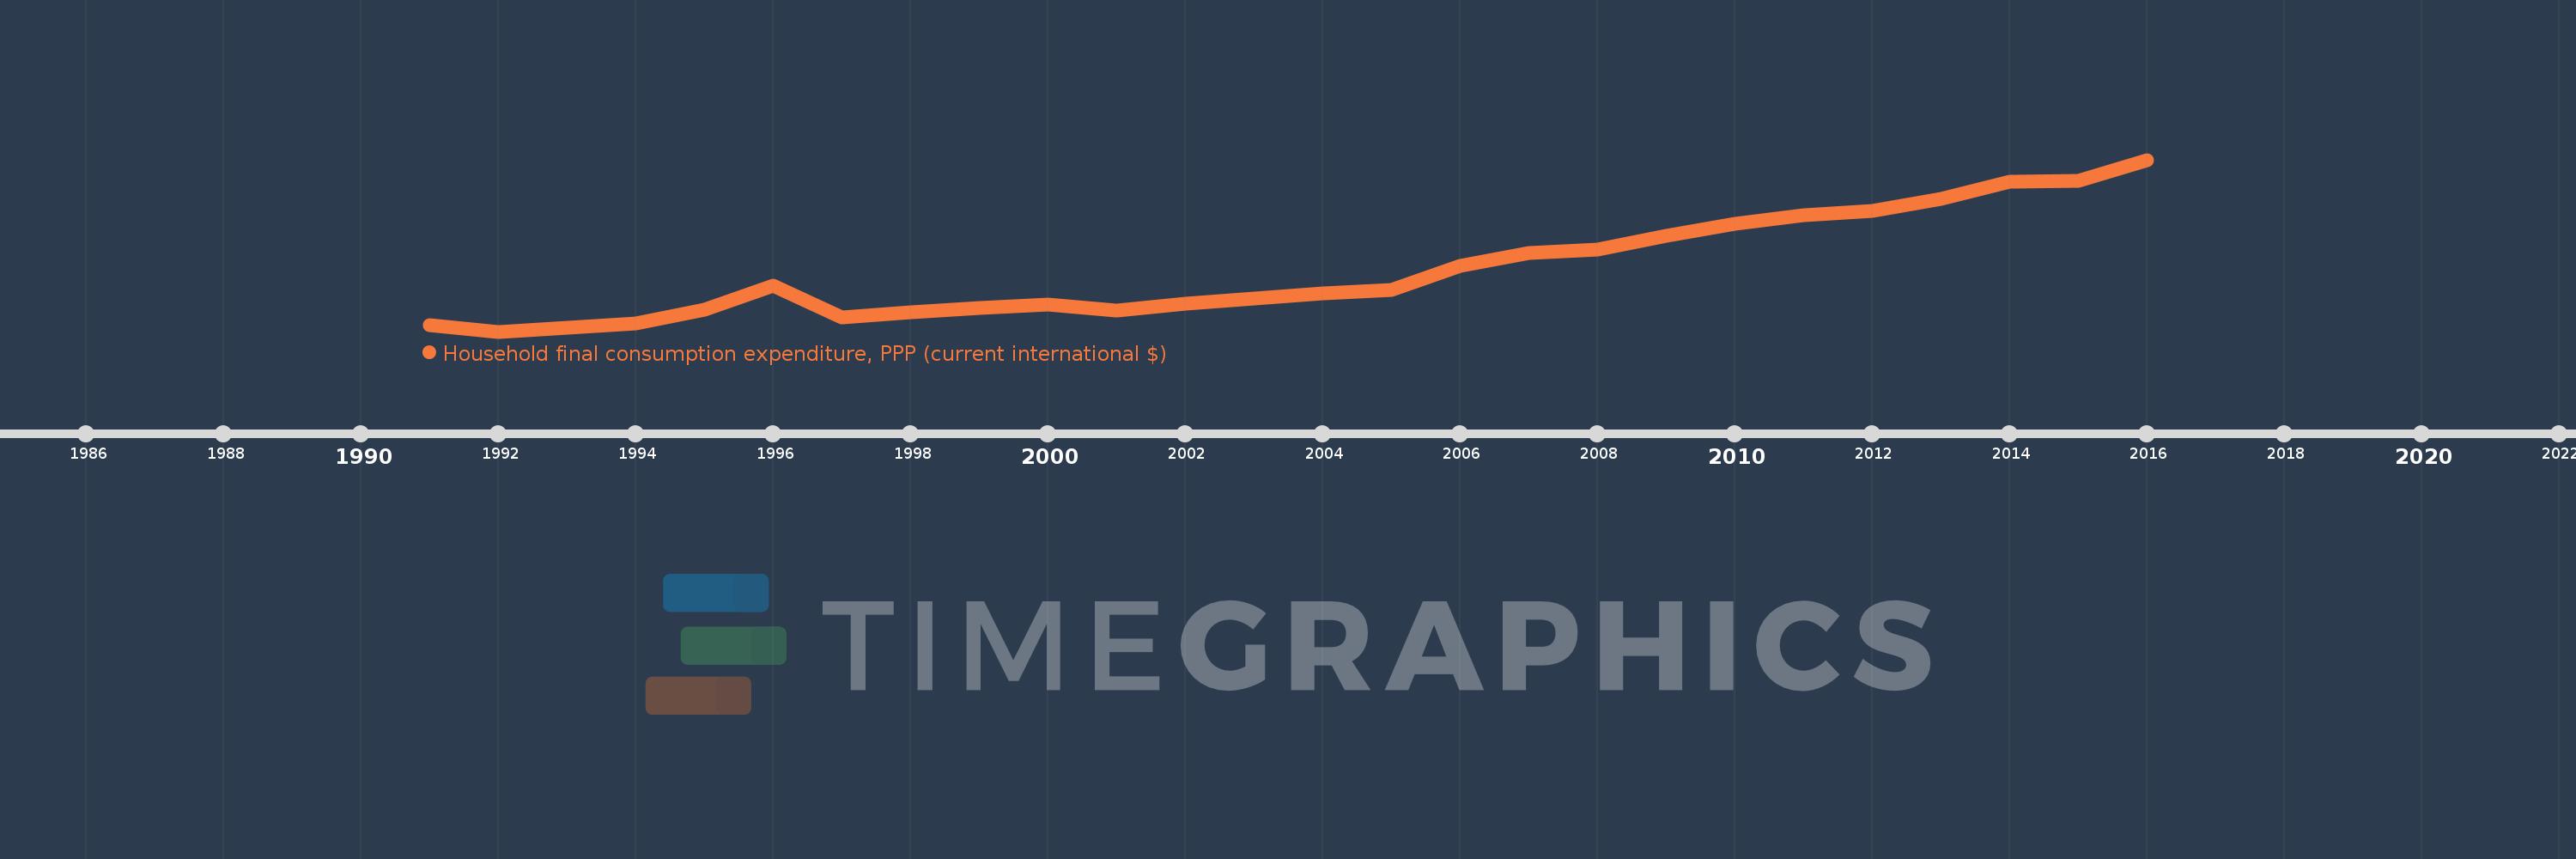
Household final consumption expenditure, PPP (current international $)
2016,2015,2014,2013,2012,2011,2010,2009,2008,2007,2006,2005,2004,2003,2002,2001,2000,1999,1998,1997,1996,1995,1994,1993,1992,1991
Estas estadísticas en otros países:
AfghanistanAlbaniaAlgeriaAngolaAntigua and BarbudaArab WorldArgentinaArmeniaArubaAustraliaAustriaAzerbaijanBahamas, TheBahrainBangladeshBarbadosBelarusBelgiumBelizeBeninBermudaBhutanBoliviaBosnia and HerzegovinaBotswanaBrazilBrunei DarussalamBulgariaBurkina FasoBurundiCabo VerdeCambodiaCameroonCanadaCaribbean small statesCentral African RepublicCentral Europe and the BalticsChadChileChinaColombiaComorosCongo, Dem. Rep.Congo, Rep.Costa RicaCote d'IvoireCroatiaCubaCyprusCzech RepublicDenmarkDjiboutiDominicaDominican RepublicEarly-demographic dividendEast Asia & PacificEast Asia & Pacific (excluding high income)East Asia & Pacific (IDA & IBRD countries)EcuadorEgypt, Arab Rep.El SalvadorEquatorial GuineaEritreaEstoniaEthiopiaEuro areaEurope & Central AsiaEurope & Central Asia (excluding high income)Europe & Central Asia (IDA & IBRD countries)European UnionFijiFinlandFranceGabonGambia, TheGeorgiaGermanyGhanaGreeceGrenadaGuatemalaGuineaGuinea-BissauGuyanaHaitiHeavily indebted poor countries (HIPC)High incomeHondurasHong Kong SAR, ChinaHungaryIBRD onlyIcelandIDA & IBRD totalIDA blendIDA onlyIDA totalIndiaIndonesiaIran, Islamic Rep.IrelandIsraelItalyJamaicaJapanJordanKazakhstanKenyaKorea, Rep.KosovoKuwaitKyrgyz RepublicLao PDRLate-demographic dividendLatin America & Caribbean Latin America & Caribbean (excluding high income)Latin America & the Caribbean (IDA & IBRD countries)LatviaLeast developed countries: UN classificationLebanonLiberiaLibyaLithuaniaLow & middle incomeLow incomeLower middle incomeLuxembourgMacao SAR, ChinaMacedonia, FYRMadagascarMalawiMalaysiaMaliMaltaMauritaniaMauritiusMexicoMiddle East & North AfricaMiddle East & North Africa (excluding high income)Middle East & North Africa (IDA & IBRD countries)Middle incomeMoldovaMongoliaMontenegroMoroccoMozambiqueNamibiaNepalNetherlandsNew ZealandNicaraguaNigerNigeriaNorth AmericaNorwayOECD membersOmanOther small statesPakistanPanamaPapua New GuineaParaguayPeruPhilippinesPolandPortugalPost-demographic dividendPre-demographic dividendPuerto RicoQatarRomaniaRussian FederationRwandaSaudi ArabiaSenegalSerbiaSeychellesSierra LeoneSingaporeSlovak RepublicSloveniaSmall statesSolomon IslandsSouth AfricaSouth AsiaSouth Asia (IDA & IBRD)South SudanSpainSri LankaSt. Kitts and NevisSt. LuciaSt. Vincent and the GrenadinesSub-Saharan Africa Sub-Saharan Africa (excluding high income)Sub-Saharan Africa (IDA & IBRD countries)SudanSurinameSwazilandSwedenSwitzerlandSyrian Arab RepublicTajikistanTanzaniaThailandTimor-LesteTogoTongaTrinidad and TobagoTunisiaTurkeyTurkmenistanUgandaUkraineUnited Arab EmiratesUnited KingdomUnited StatesUpper middle incomeUruguayUzbekistanVanuatuVenezuela, RBVietnamWest Bank and GazaWorldYemen, Rep.ZambiaZimbabwe línea de tiempo (timeline):
En esta escala de tiempo se presenta un gráfico de 1991 y 2016 de Sudan. Los datos de 1990 están ausentes. El número de observaciones reales por fecha: 26.
Fuente (nombre):
Indicadores del desarrollo mundial
Fuente (organización):
World Bank, International Comparison Program database.
Categorías:
Economy & Growth
Se ha actualizado:
23 abr 2017 año
Los indicadores de los cambios de valor en los últimos años
Mínimo:
22.914 bn
1 ene 1992 año
Máximo:
108.089 bn
1 ene 2016 año
A la fecha de observación
Valor
Cambio absoluto
El cambio con respecto al valor anterior
1 ene 1991 año
26.105 bn
+26.105 bn
0.0%
1 ene 1992 año
22.914 bn
-3.191 bn
-12.22%
1 ene 1993 año
24.765 bn
+1.851 bn
8.08%
1 ene 1994 año
26.921 bn
+2.156 bn
8.71%
1 ene 1995 año
33.722 bn
+6.801 bn
25.26%
1 ene 1996 año
45.842 bn
+12.12 bn
35.94%
1 ene 1997 año
30.106 bn
-15.736 bn
-34.33%
1 ene 1998 año
32.559 bn
+2.453 bn
8.15%
1 ene 1999 año
34.503 bn
+1.944 bn
5.97%
1 ene 2000 año
36.541 bn
+2.038 bn
5.91%
1 ene 2001 año
33.215 bn
-3.326 bn
-9.1%
1 ene 2002 año
36.921 bn
+3.706 bn
11.16%
1 ene 2003 año
39.501 bn
+2.58 bn
6.99%
1 ene 2004 año
42.061 bn
+2.56 bn
6.48%
1 ene 2005 año
43.546 bn
+1.485 bn
3.53%
1 ene 2006 año
55.56 bn
+12.014 bn
27.59%
1 ene 2007 año
61.783 bn
+6.222 bn
11.2%
1 ene 2008 año
63.382 bn
+1.6 bn
2.59%
1 ene 2009 año
70.436 bn
+7.054 bn
11.13%
1 ene 2010 año
76.567 bn
+6.131 bn
8.7%
1 ene 2011 año
80.468 bn
+3.9 bn
5.09%
1 ene 2012 año
82.878 bn
+2.41 bn
3.0%
1 ene 2013 año
88.9 bn
+6.022 bn
7.27%
1 ene 2014 año
97.199 bn
+8.299 bn
9.33%
1 ene 2015 año
97.562 bn
+363.167 millones
0.37%
1 ene 2016 año
108.089 bn
+10.527 bn
10.79%
Ranking de los países por los datos estadísticos actuales


Comentarios: