29
/es/
es
AIzaSyAYiBZKx7MnpbEhh9jyipgxe19OcubqV5w
April 1, 2024
28089
East Asia & Pacific (excluding high income)
EAP
false
2
1
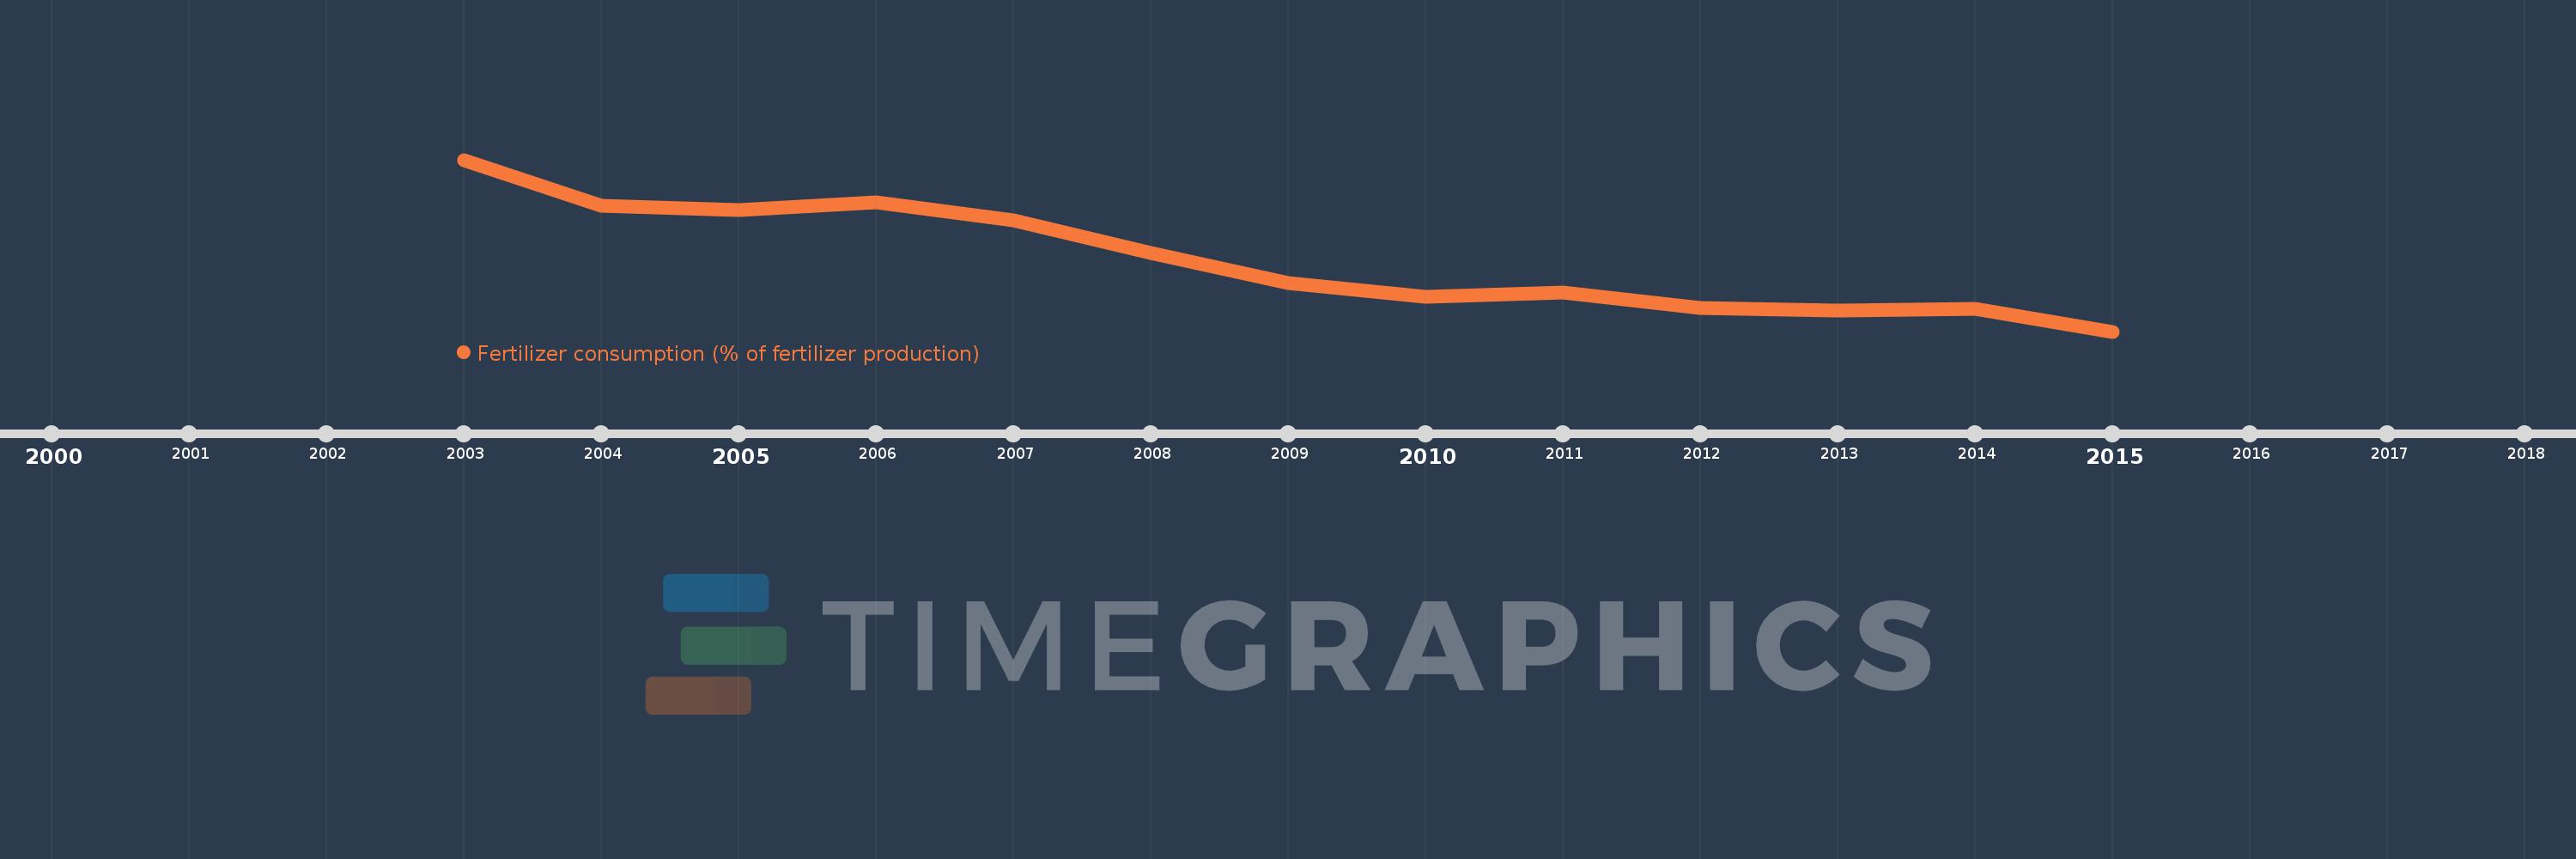
Fertilizer consumption (% of fertilizer production)
2015,2014,2013,2012,2011,2010,2009,2008,2007,2006,2005,2004,2003
Estas estadísticas en otros países:
línea de tiempo (timeline):
En esta escala de tiempo se presenta un gráfico de 2003 y 2015 de East Asia & Pacific (excluding high income). Los datos de 2002 están ausentes. El número de observaciones reales por fecha: 13.
Fuente (nombre):
Indicadores del desarrollo mundial
Fuente (organización):
Food and Agriculture Organization, electronic files and web site.
Categorías:
Agriculture & Rural Development
Se ha actualizado:
23 abr 2017 año
Los indicadores de los cambios de valor en los últimos años
Mínimo:
98.64
1 ene 2015 año
Máximo:
131.552
1 ene 2003 año
A la fecha de observación
Valor
Cambio absoluto
El cambio con respecto al valor anterior
1 ene 2003 año
131.552
+131.552
0.0%
1 ene 2004 año
122.716
-8.836
-6.72%
1 ene 2005 año
121.922
-0.794
-0.65%
1 ene 2006 año
123.353
+1.431
1.17%
1 ene 2007 año
120.018
-3.336
-2.7%
1 ene 2008 año
113.704
-6.314
-5.26%
1 ene 2009 año
107.98
-5.724
-5.03%
1 ene 2010 año
105.234
-2.746
-2.54%
1 ene 2011 año
106.121
+0.887
0.84%
1 ene 2012 año
103.114
-3.006
-2.83%
1 ene 2013 año
102.599
-0.516
-0.5%
1 ene 2014 año
103.079
+0.48
0.47%
1 ene 2015 año
98.64
-4.439
-4.31%
Ranking de los países por los datos estadísticos actuales


Comentarios: