29
/es/
es
AIzaSyAYiBZKx7MnpbEhh9jyipgxe19OcubqV5w
April 1, 2024
278724
Uzbekistan
UZB
true
2
1
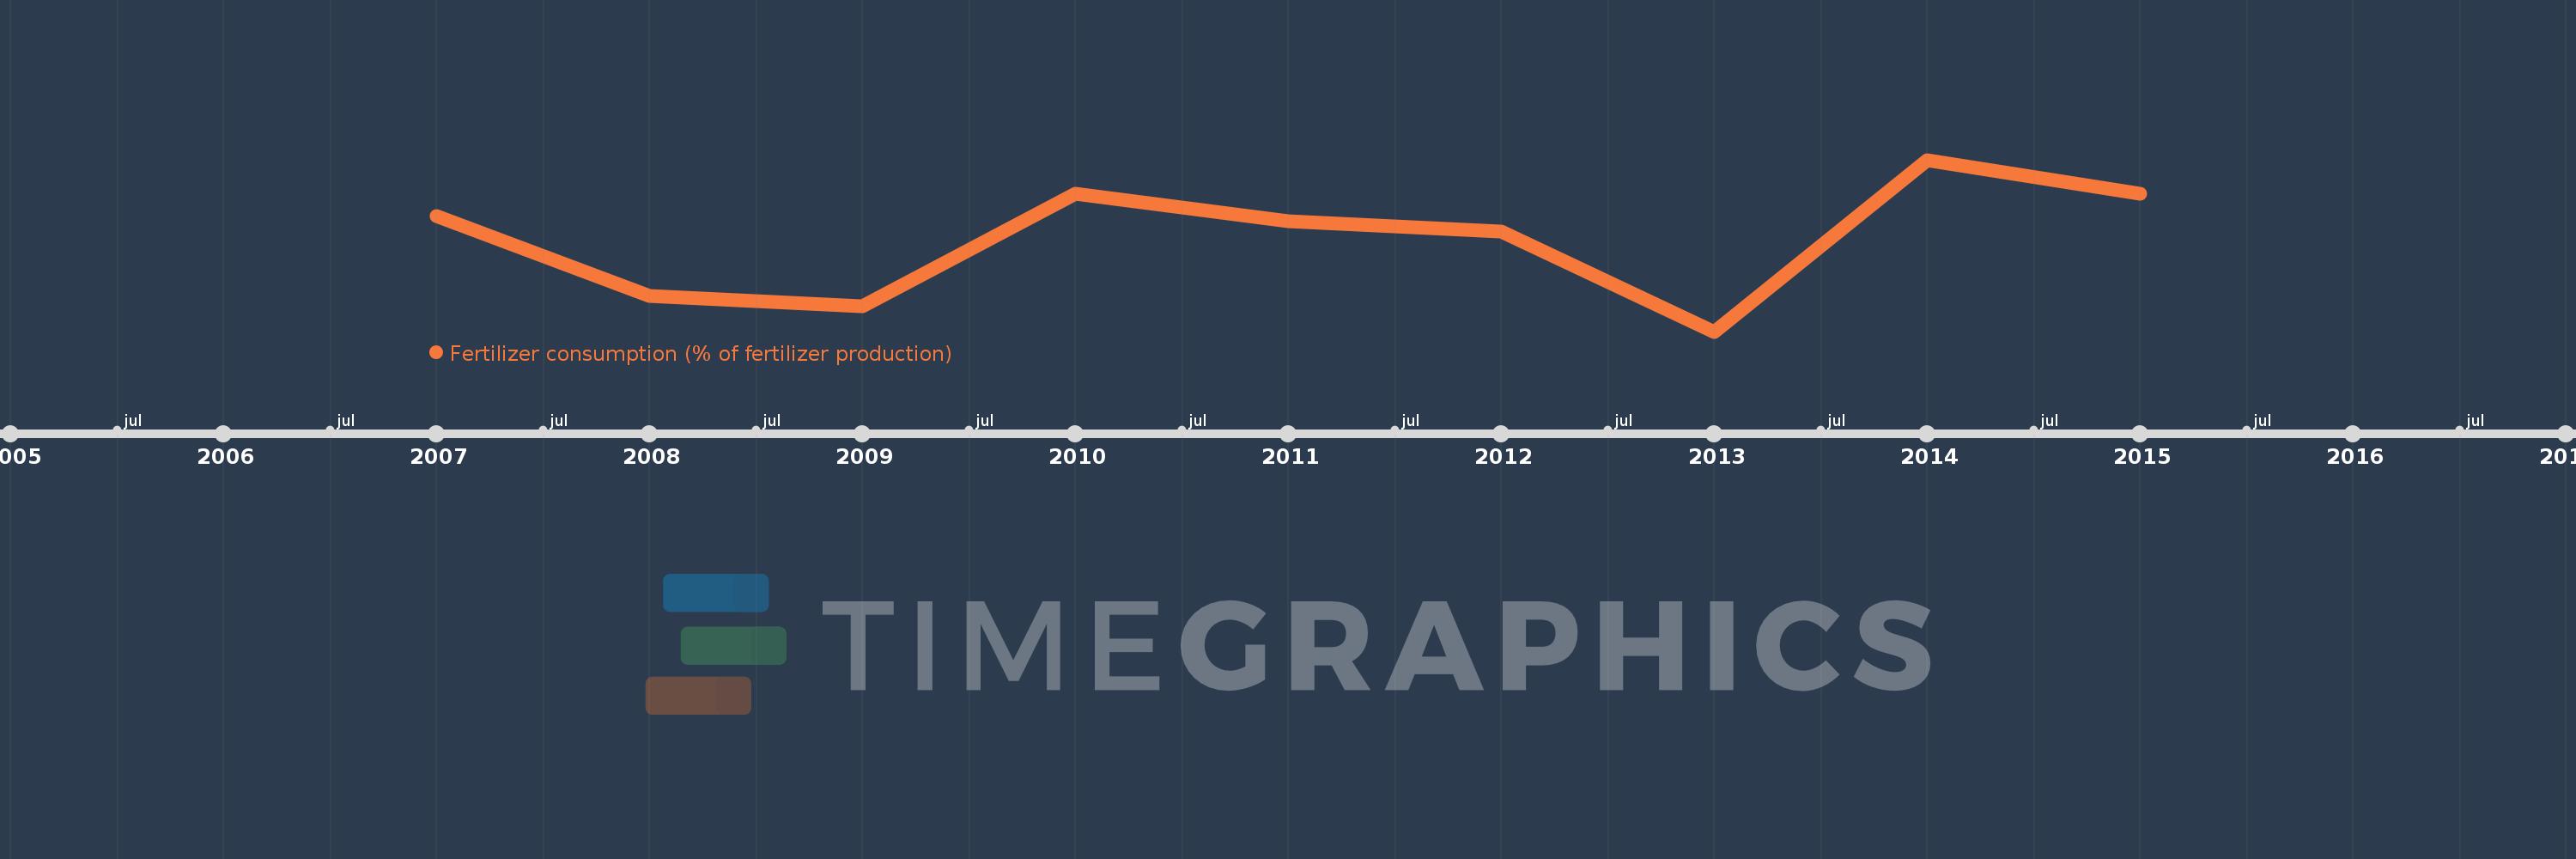
Fertilizer consumption (% of fertilizer production)
2015,2014,2013,2012,2011,2010,2009,2008,2007
Estas estadísticas en otros países:
línea de tiempo (timeline):
En esta escala de tiempo se presenta un gráfico de 2007 y 2015 de Uzbekistan. Los datos de 2006 están ausentes. El número de observaciones reales por fecha: 9.
Fuente (nombre):
Indicadores del desarrollo mundial
Fuente (organización):
Food and Agriculture Organization, electronic files and web site.
Categorías:
Agriculture & Rural Development
Se ha actualizado:
23 abr 2017 año
Los indicadores de los cambios de valor en los últimos años
Mínimo:
68.515
1 ene 2013 año
Máximo:
79.635
1 ene 2014 año
A la fecha de observación
Valor
Cambio absoluto
El cambio con respecto al valor anterior
1 ene 2007 año
76.015
+76.015
0.0%
1 ene 2008 año
70.802
-5.213
-6.86%
1 ene 2009 año
70.183
-0.62
-0.88%
1 ene 2010 año
77.464
+7.281
10.37%
1 ene 2011 año
75.641
-1.823
-2.35%
1 ene 2012 año
75.009
-0.632
-0.84%
1 ene 2013 año
68.515
-6.494
-8.66%
1 ene 2014 año
79.635
+11.12
16.23%
1 ene 2015 año
77.459
-2.176
-2.73%
Ranking de los países por los datos estadísticos actuales


Comentarios: