29
/es/
es
AIzaSyAYiBZKx7MnpbEhh9jyipgxe19OcubqV5w
April 1, 2024
280784
Venezuela, RB
VEN
true
2
1
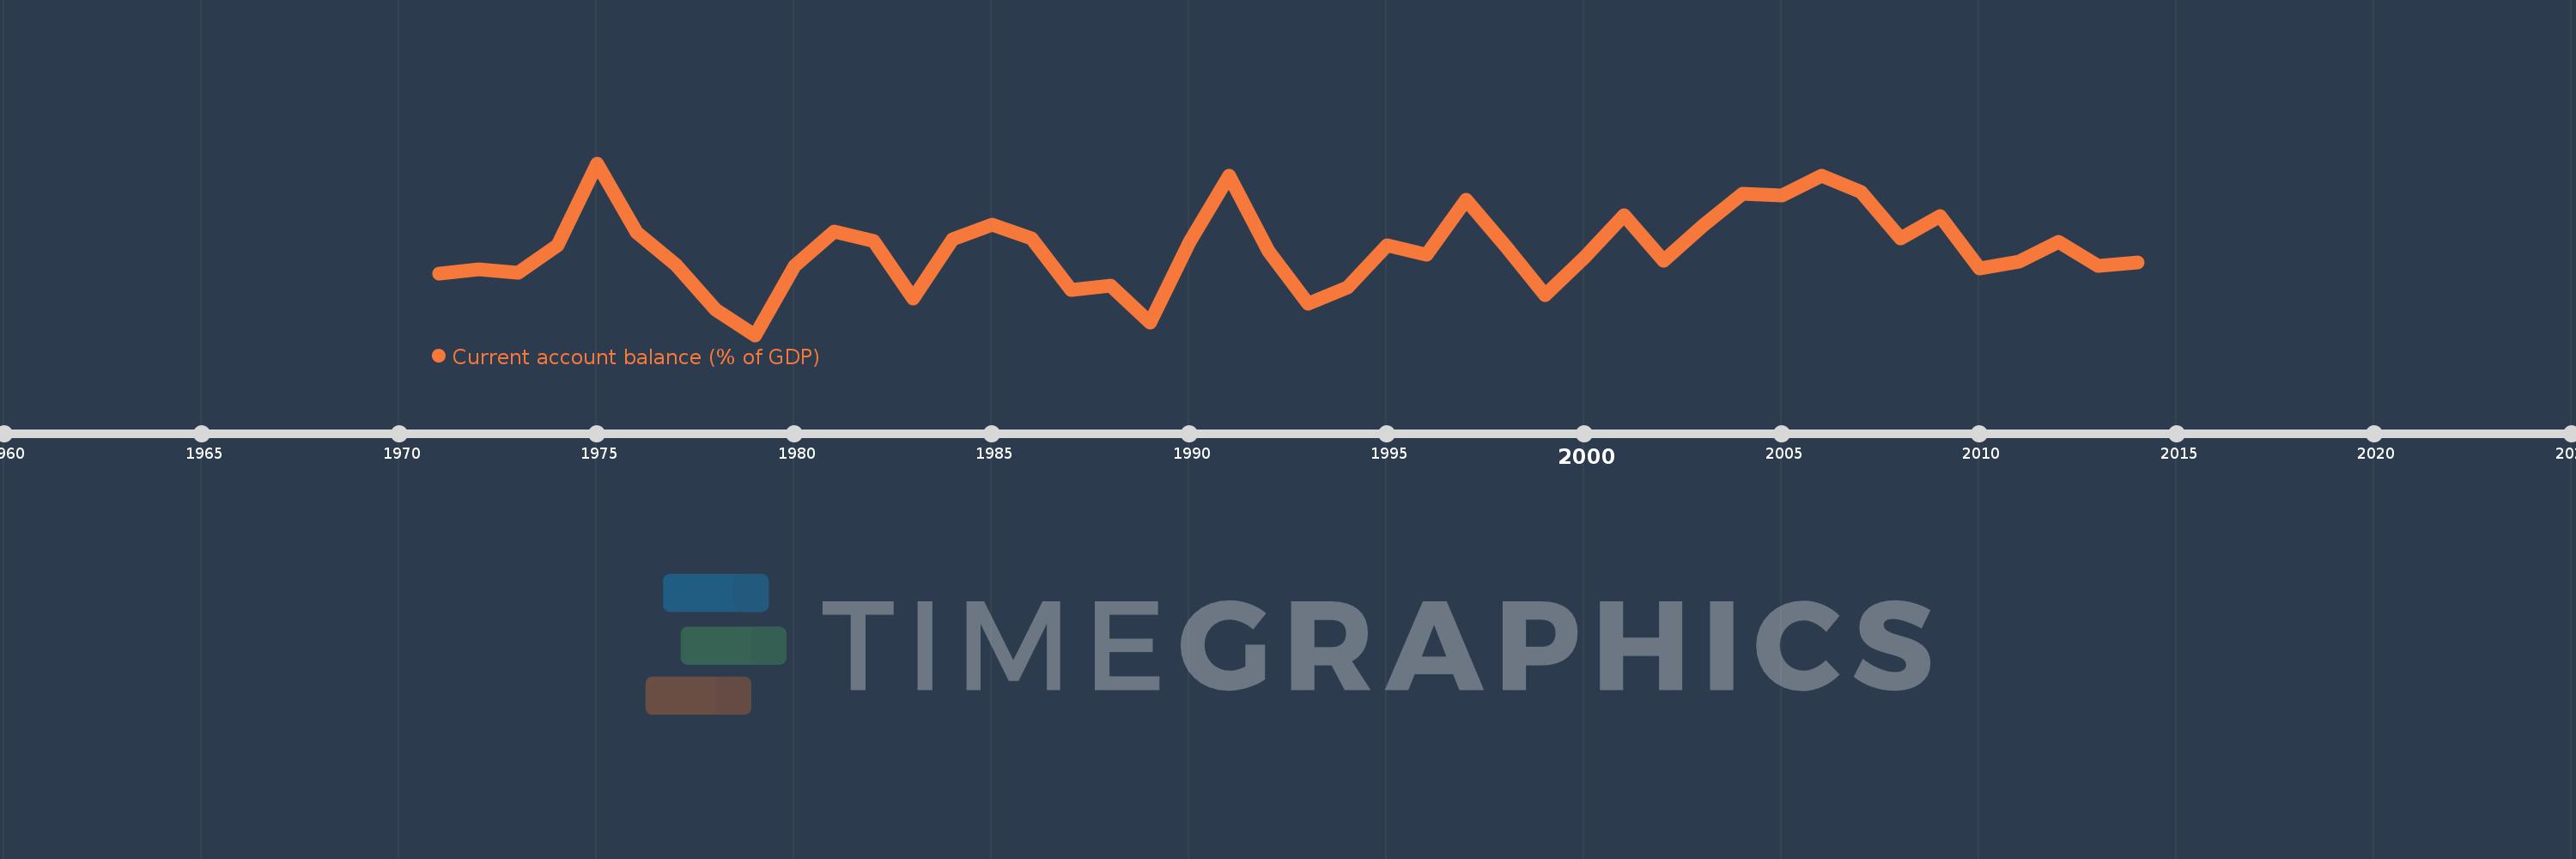
Current account balance (% of GDP)
2014,2013,2012,2011,2010,2009,2008,2007,2006,2005,2004,2003,2002,2001,2000,1999,1998,1997,1996,1995,1994,1993,1992,1991,1990,1989,1988,1987,1986,1985,1984,1983,1982,1981,1980,1979,1978,1977,1976,1975,1974,1973,1972,1971
Estas estadísticas en otros países:
AfghanistanAlbaniaAlgeriaAngolaAntigua and BarbudaArgentinaArmeniaArubaAustraliaAustriaAzerbaijanBahamas, TheBahrainBangladeshBarbadosBelarusBelgiumBelizeBeninBermudaBhutanBoliviaBosnia and HerzegovinaBotswanaBrazilBrunei DarussalamBulgariaBurkina FasoBurundiCabo VerdeCambodiaCameroonCanadaCentral African RepublicChadChileChinaColombiaComorosCongo, Dem. Rep.Congo, Rep.Costa RicaCote d'IvoireCroatiaCyprusCzech RepublicDenmarkDjiboutiDominicaDominican RepublicEcuadorEgypt, Arab Rep.El SalvadorEquatorial GuineaEritreaEstoniaEthiopiaFaroe IslandsFijiFinlandFranceGabonGambia, TheGeorgiaGermanyGhanaGreeceGrenadaGuatemalaGuineaGuinea-BissauGuyanaHaitiHondurasHong Kong SAR, ChinaHungaryIcelandIndiaIndonesiaIran, Islamic Rep.IraqIrelandIsraelItalyJamaicaJapanJordanKazakhstanKenyaKiribatiKorea, Rep.KosovoKuwaitKyrgyz RepublicLao PDRLatviaLebanonLesothoLiberiaLibyaLithuaniaLuxembourgMacao SAR, ChinaMacedonia, FYRMadagascarMalawiMalaysiaMaldivesMaliMaltaMarshall IslandsMauritaniaMauritiusMexicoMicronesia, Fed. Sts.MoldovaMongoliaMontenegroMoroccoMozambiqueMyanmarNamibiaNepalNetherlandsNew ZealandNicaraguaNigerNigeriaNorwayOmanPakistanPalauPanamaPapua New GuineaParaguayPeruPhilippinesPolandPortugalQatarRomaniaRussian FederationRwandaSamoaSao Tome and PrincipeSaudi ArabiaSenegalSerbiaSeychellesSierra LeoneSingaporeSlovak RepublicSloveniaSolomon IslandsSouth AfricaSouth SudanSpainSri LankaSt. Kitts and NevisSt. LuciaSt. Vincent and the GrenadinesSudanSurinameSwazilandSwedenSwitzerlandSyrian Arab RepublicTajikistanTanzaniaThailandTimor-LesteTogoTongaTrinidad and TobagoTunisiaTurkeyTuvaluUgandaUkraineUnited KingdomUnited StatesUruguayVanuatuVenezuela, RBVietnamWest Bank and GazaYemen, Rep.ZambiaZimbabwe línea de tiempo (timeline):
En esta escala de tiempo se presenta un gráfico de 1971 y 2014 de Venezuela, RB. Los datos de 1970 están ausentes. El número de observaciones reales por fecha: 44.
Fuente (nombre):
Indicadores del desarrollo mundial
Fuente (organización):
International Monetary Fund, Balance of Payments Statistics Yearbook and data files, and World Bank and OECD GDP estimates.
Categorías:
Economy & Growth
Se ha actualizado:
23 abr 2017 año
Los indicadores de los cambios de valor en los últimos años
Mínimo:
-12.353
1 ene 1979 año
Máximo:
19.872
1 ene 1975 año
A la fecha de observación
Valor
Cambio absoluto
El cambio con respecto al valor anterior
1 ene 1971 año
-0.809
-0.809
0.0%
1 ene 1972 año
-0.075
+0.734
-90.71%
1 ene 1973 año
-0.634
-0.559
743.36%
1 ene 1974 año
4.505
+5.14
-810.26%
1 ene 1975 año
19.872
+15.367
341.09%
1 ene 1976 año
6.935
-12.937
-65.1%
1 ene 1977 año
0.702
-6.233
-89.88%
1 ene 1978 año
-7.522
-8.224
-1.17 mil%
1 ene 1979 año
-12.353
-4.831
64.23%
1 ene 1980 año
0.629
+12.982
-105.09%
1 ene 1981 año
7.055
+6.426
1.02 mil%
1 ene 1982 año
5.307
-1.747
-24.77%
1 ene 1983 año
-5.546
-10.853
-204.5%
1 ene 1984 año
5.637
+11.183
-201.63%
1 ene 1985 año
8.292
+2.655
47.11%
1 ene 1986 año
5.743
-2.549
-30.74%
1 ene 1987 año
-3.818
-9.561
-166.49%
1 ene 1988 año
-3.065
+0.753
-19.72%
1 ene 1989 año
-9.942
-6.877
224.32%
1 ene 1990 año
5.131
+15.073
-151.6%
1 ene 1991 año
17.604
+12.474
243.13%
1 ene 1992 año
3.355
-14.25
-80.94%
1 ene 1993 año
-6.414
-9.769
-291.2%
1 ene 1994 año
-3.429
+2.985
-46.54%
1 ene 1995 año
4.495
+7.924
-231.09%
1 ene 1996 año
2.689
-1.806
-40.18%
1 ene 1997 año
13.058
+10.369
385.67%
1 ene 1998 año
4.347
-8.711
-66.71%
1 ene 1999 año
-4.853
-9.2
-211.62%
1 ene 2000 año
2.156
+7.008
-144.42%
1 ene 2001 año
10.119
+7.963
369.41%
1 ene 2002 año
1.613
-8.505
-84.05%
1 ene 2003 año
8.18
+6.567
407.01%
1 ene 2004 año
14.107
+5.926
72.45%
1 ene 2005 año
13.8
-0.306
-2.17%
1 ene 2006 año
17.488
+3.688
26.72%
1 ene 2007 año
14.422
-3.066
-17.53%
1 ene 2008 año
5.845
-8.578
-59.48%
1 ene 2009 año
9.917
+4.072
69.67%
1 ene 2010 año
0.13
-9.786
-98.69%
1 ene 2011 año
1.418
+1.288
989.02%
1 ene 2012 año
5.164
+3.745
264.09%
1 ene 2013 año
0.678
-4.485
-86.87%
1 ene 2014 año
1.24
+0.562
82.81%
Ranking de los países por los datos estadísticos actuales


Comentarios: