29
/es/
es
AIzaSyAYiBZKx7MnpbEhh9jyipgxe19OcubqV5w
April 1, 2024
125981
El Salvador
SLV
true
2
1
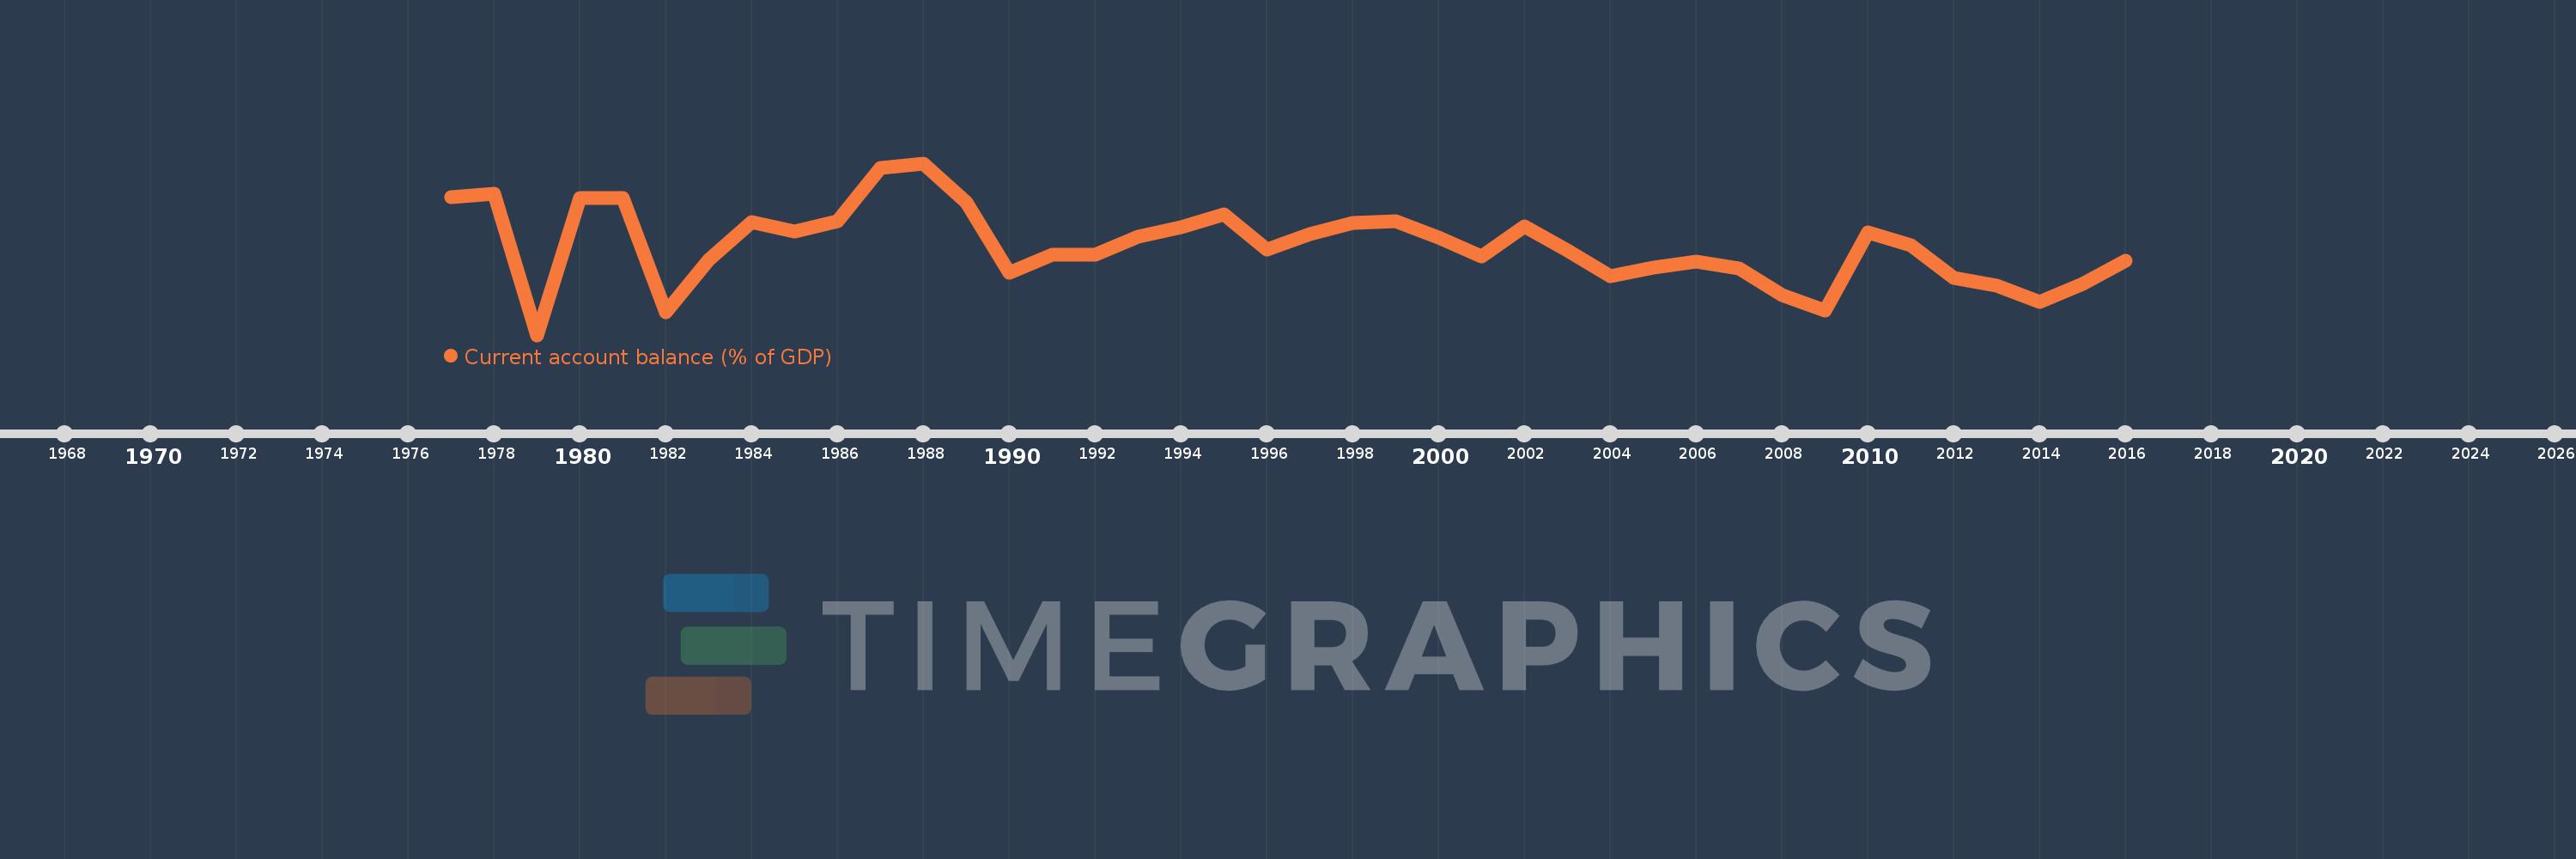
Current account balance (% of GDP)
2016,2015,2014,2013,2012,2011,2010,2009,2008,2007,2006,2005,2004,2003,2002,2001,2000,1999,1998,1997,1996,1995,1994,1993,1992,1991,1990,1989,1988,1987,1986,1985,1984,1983,1982,1981,1980,1979,1978,1977
Estas estadísticas en otros países:
AfghanistanAlbaniaAlgeriaAngolaAntigua and BarbudaArgentinaArmeniaArubaAustraliaAustriaAzerbaijanBahamas, TheBahrainBangladeshBarbadosBelarusBelgiumBelizeBeninBermudaBhutanBoliviaBosnia and HerzegovinaBotswanaBrazilBrunei DarussalamBulgariaBurkina FasoBurundiCabo VerdeCambodiaCameroonCanadaCentral African RepublicChadChileChinaColombiaComorosCongo, Dem. Rep.Congo, Rep.Costa RicaCote d'IvoireCroatiaCyprusCzech RepublicDenmarkDjiboutiDominicaDominican RepublicEcuadorEgypt, Arab Rep.El SalvadorEquatorial GuineaEritreaEstoniaEthiopiaFaroe IslandsFijiFinlandFranceGabonGambia, TheGeorgiaGermanyGhanaGreeceGrenadaGuatemalaGuineaGuinea-BissauGuyanaHaitiHondurasHong Kong SAR, ChinaHungaryIcelandIndiaIndonesiaIran, Islamic Rep.IraqIrelandIsraelItalyJamaicaJapanJordanKazakhstanKenyaKiribatiKorea, Rep.KosovoKuwaitKyrgyz RepublicLao PDRLatviaLebanonLesothoLiberiaLibyaLithuaniaLuxembourgMacao SAR, ChinaMacedonia, FYRMadagascarMalawiMalaysiaMaldivesMaliMaltaMarshall IslandsMauritaniaMauritiusMexicoMicronesia, Fed. Sts.MoldovaMongoliaMontenegroMoroccoMozambiqueMyanmarNamibiaNepalNetherlandsNew ZealandNicaraguaNigerNigeriaNorwayOmanPakistanPalauPanamaPapua New GuineaParaguayPeruPhilippinesPolandPortugalQatarRomaniaRussian FederationRwandaSamoaSao Tome and PrincipeSaudi ArabiaSenegalSerbiaSeychellesSierra LeoneSingaporeSlovak RepublicSloveniaSolomon IslandsSouth AfricaSouth SudanSpainSri LankaSt. Kitts and NevisSt. LuciaSt. Vincent and the GrenadinesSudanSurinameSwazilandSwedenSwitzerlandSyrian Arab RepublicTajikistanTanzaniaThailandTimor-LesteTogoTongaTrinidad and TobagoTunisiaTurkeyTuvaluUgandaUkraineUnited KingdomUnited StatesUruguayVanuatuVenezuela, RBVietnamWest Bank and GazaYemen, Rep.ZambiaZimbabwe línea de tiempo (timeline):
En esta escala de tiempo se presenta un gráfico de 1977 y 2016 de El Salvador. Los datos de 1976 están ausentes. El número de observaciones reales por fecha: 40.
Fuente (nombre):
Indicadores del desarrollo mundial
Fuente (organización):
International Monetary Fund, Balance of Payments Statistics Yearbook and data files, and World Bank and OECD GDP estimates.
Categorías:
Economy & Growth
Se ha actualizado:
23 abr 2017 año
Los indicadores de los cambios de valor en los últimos años
Mínimo:
-8.911
1 ene 1979 año
Máximo:
3.431
1 ene 1988 año
A la fecha de observación
Valor
Cambio absoluto
El cambio con respecto al valor anterior
1 ene 1977 año
1.015
+1.015
0.0%
1 ene 1978 año
1.27
+0.255
25.08%
1 ene 1979 año
-8.911
-10.181
-801.6%
1 ene 1980 año
0.931
+9.841
-110.45%
1 ene 1981 año
0.949
+0.018
1.96%
1 ene 1982 año
-7.288
-8.238
-867.95%
1 ene 1983 año
-3.531
+3.757
-51.55%
1 ene 1984 año
-0.793
+2.739
-77.55%
1 ene 1985 año
-1.467
-0.674
85.04%
1 ene 1986 año
-0.755
+0.712
-48.56%
1 ene 1987 año
3.098
+3.853
-510.55%
1 ene 1988 año
3.431
+0.333
10.74%
1 ene 1989 año
0.616
-2.815
-82.05%
1 ene 1990 año
-4.447
-5.063
-822.21%
1 ene 1991 año
-3.161
+1.286
-28.93%
1 ene 1992 año
-3.153
+0.008
-0.24%
1 ene 1993 año
-1.83
+1.323
-41.97%
1 ene 1994 año
-1.179
+0.651
-35.55%
1 ene 1995 año
-0.222
+0.957
-81.14%
1 ene 1996 año
-2.753
-2.531
1.14 mil%
1 ene 1997 año
-1.639
+1.115
-40.48%
1 ene 1998 año
-0.878
+0.761
-46.43%
1 ene 1999 año
-0.755
+0.123
-13.98%
1 ene 2000 año
-1.92
-1.165
154.2%
1 ene 2001 año
-3.278
-1.358
70.73%
1 ene 2002 año
-1.088
+2.19
-66.8%
1 ene 2003 año
-2.832
-1.744
160.25%
1 ene 2004 año
-4.667
-1.835
64.79%
1 ene 2005 año
-4.063
+0.604
-12.94%
1 ene 2006 año
-3.636
+0.427
-10.5%
1 ene 2007 año
-4.127
-0.491
13.49%
1 ene 2008 año
-6.051
-1.924
46.63%
1 ene 2009 año
-7.149
-1.098
18.15%
1 ene 2010 año
-1.511
+5.638
-78.86%
1 ene 2011 año
-2.488
-0.977
64.63%
1 ene 2012 año
-4.805
-2.317
93.14%
1 ene 2013 año
-5.373
-0.568
11.82%
1 ene 2014 año
-6.512
-1.139
21.19%
1 ene 2015 año
-5.236
+1.275
-19.58%
1 ene 2016 año
-3.559
+1.677
-32.03%
Ranking de los países por los datos estadísticos actuales


Comentarios: