29
/es/
es
AIzaSyAYiBZKx7MnpbEhh9jyipgxe19OcubqV5w
April 1, 2024
280733
Venezuela, RB
VEN
true
2
1
CO2 emissions from solid fuel consumption (kt)
2014,2013,2012,2011,2010,2009,2008,2007,2006,2005,2004,2003,2002,2001,2000,1999,1998,1997,1996,1995,1994,1993,1992,1991,1990,1989,1988,1987,1986,1985,1984,1983,1982,1981,1980,1979,1978,1977,1976,1975,1974,1973,1972,1971,1970,1969,1968,1967,1966,1965,1964,1963,1962,1961
Estas estadísticas en otros países:
AfghanistanAlbaniaAlgeriaAndorraAngolaAntigua and BarbudaArgentinaArmeniaArubaAustraliaAustriaAzerbaijanBahamas, TheBahrainBangladeshBarbadosBelarusBelgiumBelizeBeninBermudaBhutanBoliviaBosnia and HerzegovinaBotswanaBrazilBritish Virgin IslandsBrunei DarussalamBulgariaBurkina FasoBurundiCabo VerdeCambodiaCameroonCanadaCayman IslandsCentral African RepublicCentral Europe and the BalticsChadChileChinaColombiaComorosCongo, Dem. Rep.Congo, Rep.Costa RicaCote d'IvoireCroatiaCubaCuracaoCyprusCzech RepublicDenmarkDjiboutiDominicaDominican RepublicEarly-demographic dividendEast Asia & PacificEast Asia & Pacific (excluding high income)East Asia & Pacific (IDA & IBRD countries)EcuadorEgypt, Arab Rep.El SalvadorEquatorial GuineaEritreaEstoniaEthiopiaEuro areaEurope & Central AsiaEurope & Central Asia (excluding high income)Europe & Central Asia (IDA & IBRD countries)European UnionFaroe IslandsFijiFinlandFranceFrench PolynesiaGabonGambia, TheGeorgiaGermanyGhanaGibraltarGreeceGreenlandGrenadaGuatemalaGuineaGuinea-BissauGuyanaHaitiHigh incomeHondurasHong Kong SAR, ChinaHungaryIBRD onlyIcelandIDA & IBRD totalIDA blendIDA totalIndiaIndonesiaIran, Islamic Rep.IraqIrelandIsraelItalyJamaicaJapanJordanKazakhstanKenyaKiribatiKorea, Dem. People’s Rep.Korea, Rep.KuwaitKyrgyz RepublicLao PDRLate-demographic dividendLatin America & Caribbean Latin America & Caribbean (excluding high income)Latin America & the Caribbean (IDA & IBRD countries)LatviaLebanonLesothoLiberiaLibyaLiechtensteinLithuaniaLow & middle incomeLower middle incomeLuxembourgMacao SAR, ChinaMacedonia, FYRMadagascarMalawiMalaysiaMaldivesMaliMaltaMarshall IslandsMauritaniaMauritiusMexicoMicronesia, Fed. Sts.Middle East & North Africa (excluding high income)Middle East & North Africa (IDA & IBRD countries)Middle incomeMoldovaMongoliaMontenegroMoroccoMozambiqueMyanmarNamibiaNauruNepalNetherlandsNew CaledoniaNew ZealandNicaraguaNigerNigeriaNorth AmericaNorwayOECD membersOmanPakistanPalauPanamaPapua New GuineaParaguayPeruPhilippinesPolandPortugalPost-demographic dividendQatarRomaniaRussian FederationRwandaSamoaSao Tome and PrincipeSaudi ArabiaSenegalSerbiaSeychellesSierra LeoneSingaporeSint Maarten (Dutch part)Slovak RepublicSloveniaSolomon IslandsSomaliaSouth AfricaSouth AsiaSouth Asia (IDA & IBRD)South SudanSpainSri LankaSt. Kitts and NevisSt. LuciaSt. Vincent and the GrenadinesSudanSurinameSwazilandSwedenSwitzerlandSyrian Arab RepublicTajikistanTanzaniaThailandTimor-LesteTogoTongaTrinidad and TobagoTunisiaTurkeyTurkmenistanTurks and Caicos IslandsUgandaUkraineUnited Arab EmiratesUnited KingdomUnited StatesUpper middle incomeUruguayUzbekistanVanuatuVenezuela, RBVietnamWest Bank and GazaWorldYemen, Rep.ZambiaZimbabwe línea de tiempo (timeline):
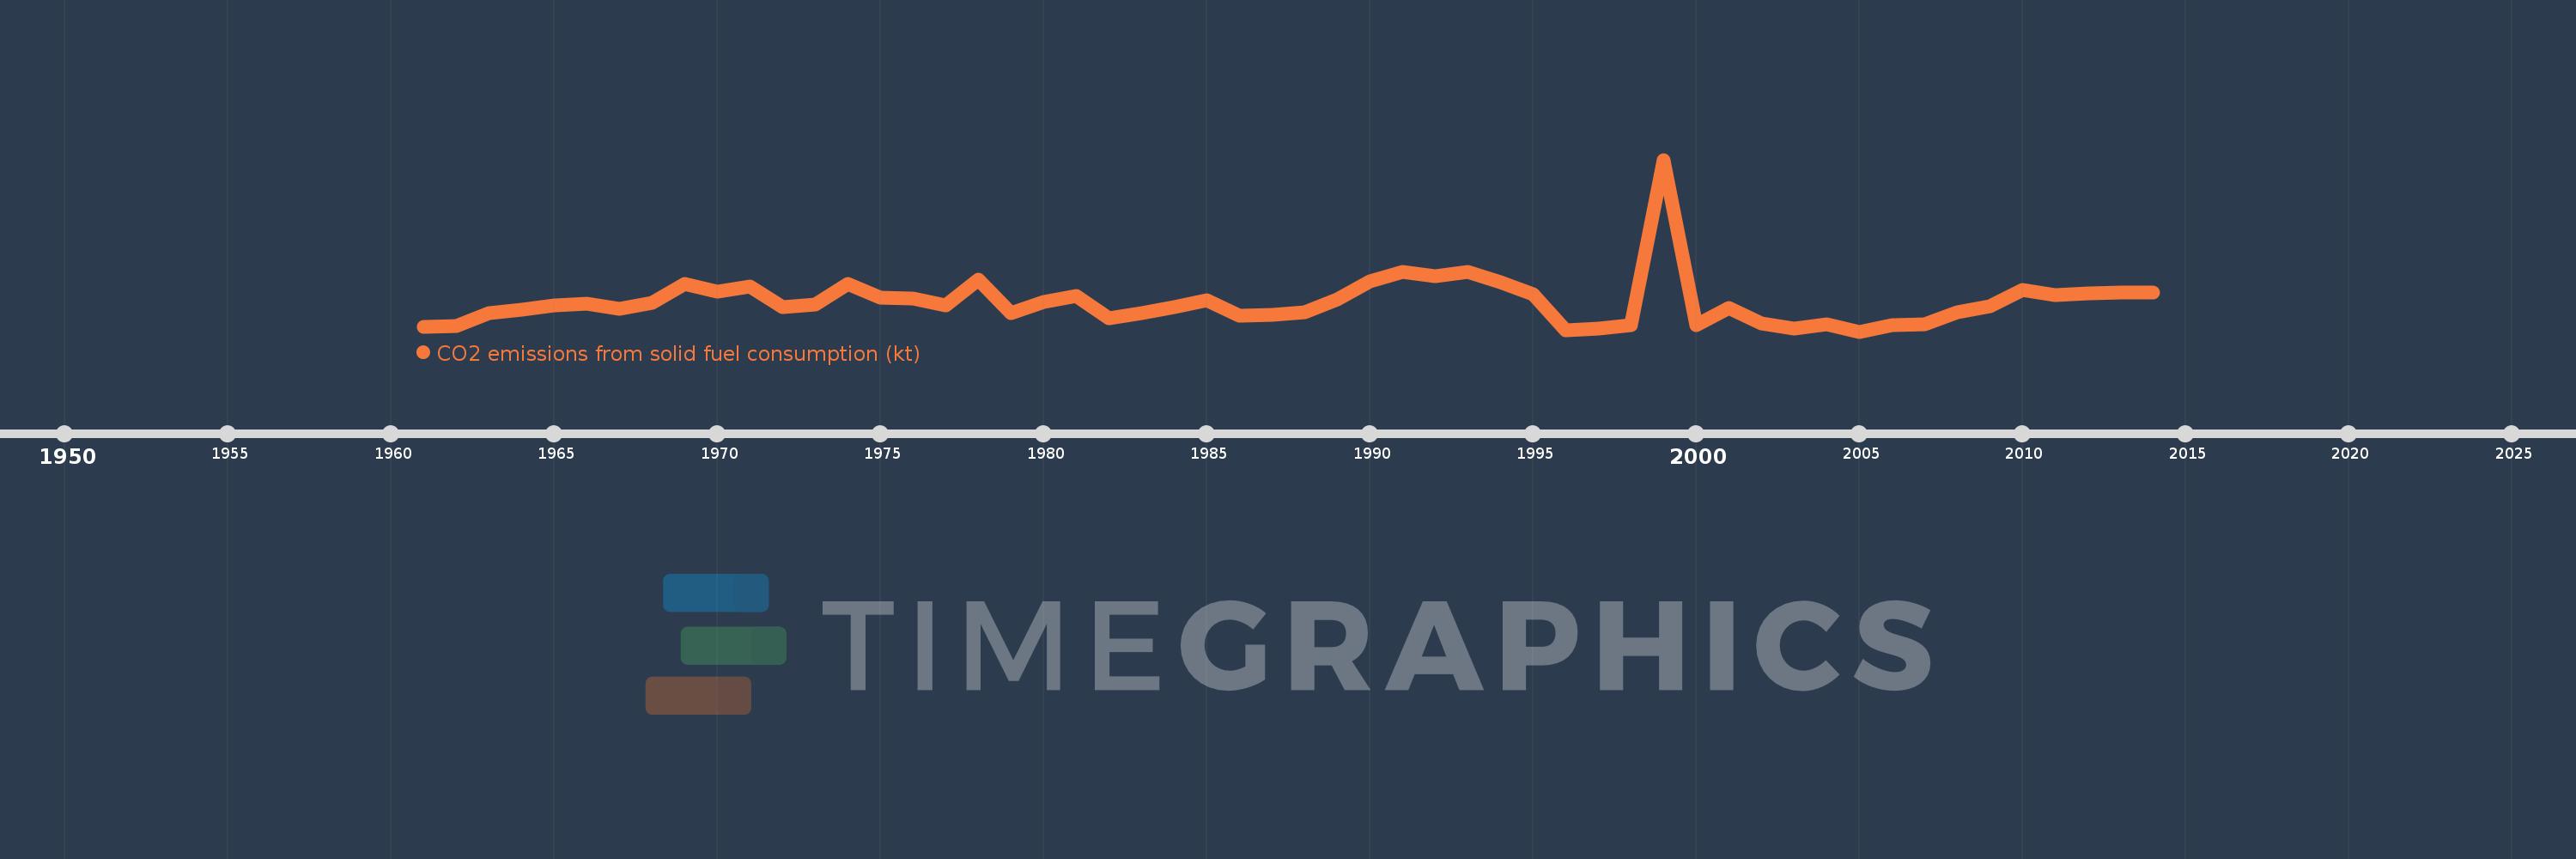
En esta escala de tiempo se presenta un gráfico de 1961 y 2014 de Venezuela, RB. Los datos de 1960 están ausentes. El número de observaciones reales por fecha: 54.
Fuente (nombre):
Indicadores del desarrollo mundial
Fuente (organización):
Carbon Dioxide Information Analysis Center, Environmental Sciences Division, Oak Ridge National Laboratory, Tennessee, United States.
Categorías:
Climate Change, Environment
Se ha actualizado:
23 abr 2017 año
Los indicadores de los cambios de valor en los últimos años
Máximo:
3.52 mil
1 ene 1999 año
A la fecha de observación
Valor
Cambio absoluto
El cambio con respecto al valor anterior
1 ene 1961 año
95.342
+95.342
0.0%
1 ene 1962 año
113.677
+18.335
19.23%
1 ene 1963 año
377.701
+264.024
232.26%
1 ene 1964 año
451.041
+73.34
19.42%
1 ene 1965 año
531.715
+80.674
17.89%
1 ene 1966 año
568.385
+36.67
6.9%
1 ene 1967 año
473.043
-95.342
-16.77%
1 ene 1968 año
597.721
+124.678
26.36%
1 ene 1969 año
982.756
+385.035
64.42%
1 ene 1970 año
810.407
-172.349
-17.54%
1 ene 1971 año
924.084
+113.677
14.03%
1 ene 1972 año
495.045
-429.039
-46.43%
1 ene 1973 año
546.383
+51.338
10.37%
1 ene 1974 año
982.756
+436.373
79.87%
1 ene 1975 año
704.064
-278.692
-28.36%
1 ene 1976 año
671.061
-33.003
-4.69%
1 ene 1977 año
539.049
-132.012
-19.67%
1 ene 1978 año
1.071 mil
+531.715
98.64%
1 ene 1979 año
374.034
-696.73
-65.07%
1 ene 1980 año
601.388
+227.354
60.78%
1 ene 1981 año
733.4
+132.012
21.95%
1 ene 1982 año
271.358
-462.042
-63.0%
1 ene 1983 año
381.368
+110.01
40.54%
1 ene 1984 año
502.379
+121.011
31.73%
1 ene 1985 año
634.391
+132.012
26.28%
1 ene 1986 año
326.363
-308.028
-48.55%
1 ene 1987 año
337.364
+11.001
3.37%
1 ene 1988 año
399.703
+62.339
18.48%
1 ene 1989 año
663.727
+264.024
66.06%
1 ene 1990 año
1.027 mil
+363.033
54.7%
1 ene 1991 año
1.217 mil
+190.684
18.57%
1 ene 1992 año
1.14 mil
-77.007
-6.33%
1 ene 1993 año
1.232 mil
+91.675
8.04%
1 ene 1994 año
1.005 mil
-227.354
-18.45%
1 ene 1995 año
762.736
-242.022
-24.09%
1 ene 1996 año
18.335
-744.401
-97.6%
1 ene 1997 año
58.672
+40.337
220.0%
1 ene 1998 año
124.678
+66.006
112.5%
1 ene 1999 año
3.52 mil
+3.396 mil
2.72 mil%
1 ene 2000 año
132.012
-3.388 mil
-96.25%
1 ene 2001 año
476.71
+344.698
261.11%
1 ene 2002 año
176.016
-300.694
-63.08%
1 ene 2003 año
66.006
-110.01
-62.5%
1 ene 2004 año
157.681
+91.675
138.89%
1 ene 2005 año
0.0
-157.681
-100.0%
1 ene 2006 año
135.679
+135.679
%
1 ene 2007 año
157.681
+22.002
16.22%
1 ene 2008 año
403.37
+245.689
155.81%
1 ene 2009 año
513.38
+110.01
27.27%
1 ene 2010 año
861.745
+348.365
67.86%
1 ene 2011 año
755.402
-106.343
-12.34%
1 ene 2012 año
777.404
+22.002
2.91%
1 ene 2013 año
799.406
+22.002
2.83%
1 ene 2014 año
795.739
-3.667
-0.46%
Ranking de los países por los datos estadísticos actuales


Comentarios: