29
/es/
es
AIzaSyAYiBZKx7MnpbEhh9jyipgxe19OcubqV5w
April 1, 2024
254984
Swaziland
SWZ
true
2
1
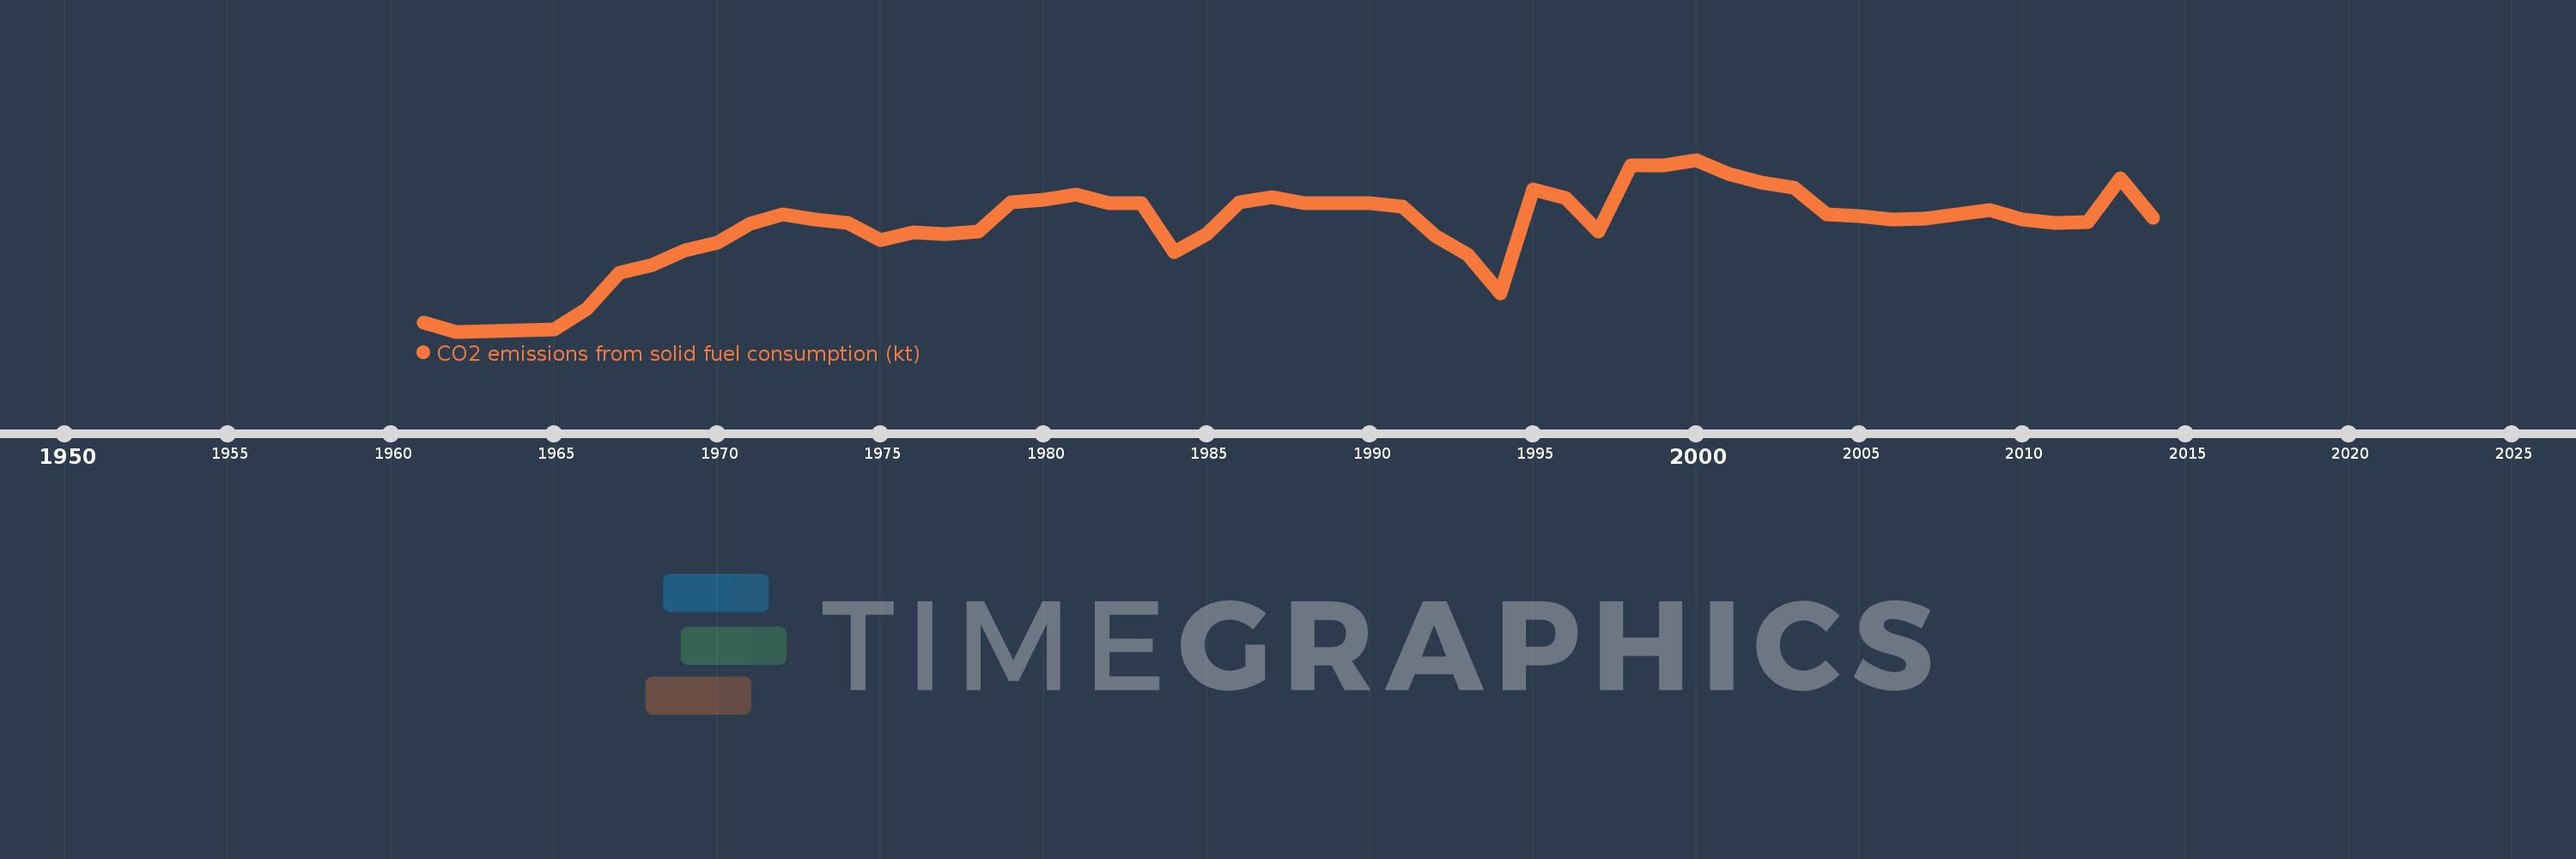
CO2 emissions from solid fuel consumption (kt)
2014,2013,2012,2011,2010,2009,2008,2007,2006,2005,2004,2003,2002,2001,2000,1999,1998,1997,1996,1995,1994,1993,1992,1991,1990,1989,1988,1987,1986,1985,1984,1983,1982,1981,1980,1979,1978,1977,1976,1975,1974,1973,1972,1971,1970,1969,1968,1967,1966,1965,1962,1961
Estas estadísticas en otros países:
AfghanistanAlbaniaAlgeriaAndorraAngolaAntigua and BarbudaArgentinaArmeniaArubaAustraliaAustriaAzerbaijanBahamas, TheBahrainBangladeshBarbadosBelarusBelgiumBelizeBeninBermudaBhutanBoliviaBosnia and HerzegovinaBotswanaBrazilBritish Virgin IslandsBrunei DarussalamBulgariaBurkina FasoBurundiCabo VerdeCambodiaCameroonCanadaCayman IslandsCentral African RepublicCentral Europe and the BalticsChadChileChinaColombiaComorosCongo, Dem. Rep.Congo, Rep.Costa RicaCote d'IvoireCroatiaCubaCuracaoCyprusCzech RepublicDenmarkDjiboutiDominicaDominican RepublicEarly-demographic dividendEast Asia & PacificEast Asia & Pacific (excluding high income)East Asia & Pacific (IDA & IBRD countries)EcuadorEgypt, Arab Rep.El SalvadorEquatorial GuineaEritreaEstoniaEthiopiaEuro areaEurope & Central AsiaEurope & Central Asia (excluding high income)Europe & Central Asia (IDA & IBRD countries)European UnionFaroe IslandsFijiFinlandFranceFrench PolynesiaGabonGambia, TheGeorgiaGermanyGhanaGibraltarGreeceGreenlandGrenadaGuatemalaGuineaGuinea-BissauGuyanaHaitiHigh incomeHondurasHong Kong SAR, ChinaHungaryIBRD onlyIcelandIDA & IBRD totalIDA blendIDA totalIndiaIndonesiaIran, Islamic Rep.IraqIrelandIsraelItalyJamaicaJapanJordanKazakhstanKenyaKiribatiKorea, Dem. People’s Rep.Korea, Rep.KuwaitKyrgyz RepublicLao PDRLate-demographic dividendLatin America & Caribbean Latin America & Caribbean (excluding high income)Latin America & the Caribbean (IDA & IBRD countries)LatviaLebanonLesothoLiberiaLibyaLiechtensteinLithuaniaLow & middle incomeLower middle incomeLuxembourgMacao SAR, ChinaMacedonia, FYRMadagascarMalawiMalaysiaMaldivesMaliMaltaMarshall IslandsMauritaniaMauritiusMexicoMicronesia, Fed. Sts.Middle East & North Africa (excluding high income)Middle East & North Africa (IDA & IBRD countries)Middle incomeMoldovaMongoliaMontenegroMoroccoMozambiqueMyanmarNamibiaNauruNepalNetherlandsNew CaledoniaNew ZealandNicaraguaNigerNigeriaNorth AmericaNorwayOECD membersOmanPakistanPalauPanamaPapua New GuineaParaguayPeruPhilippinesPolandPortugalPost-demographic dividendQatarRomaniaRussian FederationRwandaSamoaSao Tome and PrincipeSaudi ArabiaSenegalSerbiaSeychellesSierra LeoneSingaporeSint Maarten (Dutch part)Slovak RepublicSloveniaSolomon IslandsSomaliaSouth AfricaSouth AsiaSouth Asia (IDA & IBRD)South SudanSpainSri LankaSt. Kitts and NevisSt. LuciaSt. Vincent and the GrenadinesSudanSurinameSwazilandSwedenSwitzerlandSyrian Arab RepublicTajikistanTanzaniaThailandTimor-LesteTogoTongaTrinidad and TobagoTunisiaTurkeyTurkmenistanTurks and Caicos IslandsUgandaUkraineUnited Arab EmiratesUnited KingdomUnited StatesUpper middle incomeUruguayUzbekistanVanuatuVenezuela, RBVietnamWest Bank and GazaWorldYemen, Rep.ZambiaZimbabwe línea de tiempo (timeline):
En esta escala de tiempo se presenta un gráfico de 1961 y 2014 de Swaziland. Los datos de 1960 están ausentes. El número de observaciones reales por fecha: 52.
Fuente (nombre):
Indicadores del desarrollo mundial
Fuente (organización):
Carbon Dioxide Information Analysis Center, Environmental Sciences Division, Oak Ridge National Laboratory, Tennessee, United States.
Categorías:
Climate Change, Environment
Se ha actualizado:
23 abr 2017 año
Los indicadores de los cambios de valor en los últimos años
Mínimo:
3.667
1 ene 1962 año
Máximo:
583.053
1 ene 2000 año
A la fecha de observación
Valor
Cambio absoluto
El cambio con respecto al valor anterior
1 ene 1961 año
33.003
+33.003
0.0%
1 ene 1962 año
3.667
-29.336
-88.89%
1 ene 1965 año
11.001
+7.334
200.0%
1 ene 1966 año
80.674
+69.673
633.33%
1 ene 1967 año
201.685
+121.011
150.0%
1 ene 1968 año
227.354
+25.669
12.73%
1 ene 1969 año
278.692
+51.338
22.58%
1 ene 1970 año
304.361
+25.669
9.21%
1 ene 1971 año
366.7
+62.339
20.48%
1 ene 1972 año
399.703
+33.003
9.0%
1 ene 1973 año
381.368
-18.335
-4.59%
1 ene 1974 año
370.367
-11.001
-2.88%
1 ene 1975 año
311.695
-58.672
-15.84%
1 ene 1976 año
337.364
+25.669
8.24%
1 ene 1977 año
333.697
-3.667
-1.09%
1 ene 1978 año
341.031
+7.334
2.2%
1 ene 1979 año
440.04
+99.009
29.03%
1 ene 1980 año
447.374
+7.334
1.67%
1 ene 1981 año
465.709
+18.335
4.1%
1 ene 1982 año
436.373
-29.336
-6.3%
1 ene 1983 año
436.373
0.0
0.0%
1 ene 1984 año
271.358
-165.015
-37.82%
1 ene 1985 año
333.697
+62.339
22.97%
1 ene 1986 año
440.04
+106.343
31.87%
1 ene 1987 año
458.375
+18.335
4.17%
1 ene 1988 año
436.373
-22.002
-4.8%
1 ene 1989 año
436.373
0.0
0.0%
1 ene 1990 año
436.373
0.0
0.0%
1 ene 1991 año
425.372
-11.001
-2.52%
1 ene 1992 año
326.363
-99.009
-23.28%
1 ene 1993 año
264.024
-62.339
-19.1%
1 ene 1994 año
132.012
-132.012
-50.0%
1 ene 1995 año
484.044
+352.032
266.67%
1 ene 1996 año
454.708
-29.336
-6.06%
1 ene 1997 año
341.031
-113.677
-25.0%
1 ene 1998 año
564.718
+223.687
65.59%
1 ene 1999 año
564.718
0.0
0.0%
1 ene 2000 año
583.053
+18.335
3.25%
1 ene 2001 año
535.382
-47.671
-8.18%
1 ene 2002 año
506.046
-29.336
-5.48%
1 ene 2003 año
487.711
-18.335
-3.62%
1 ene 2004 año
399.703
-88.008
-18.05%
1 ene 2005 año
392.369
-7.334
-1.83%
1 ene 2006 año
381.368
-11.001
-2.8%
1 ene 2007 año
385.035
+3.667
0.96%
1 ene 2008 año
399.703
+14.668
3.81%
1 ene 2009 año
414.371
+14.668
3.67%
1 ene 2010 año
381.368
-33.003
-7.96%
1 ene 2011 año
370.367
-11.001
-2.88%
1 ene 2012 año
374.034
+3.667
0.99%
1 ene 2013 año
520.714
+146.68
39.22%
1 ene 2014 año
388.702
-132.012
-25.35%
Ranking de los países por los datos estadísticos actuales


Comentarios: