29
/es/
es
AIzaSyAYiBZKx7MnpbEhh9jyipgxe19OcubqV5w
April 1, 2024
27881
East Asia & Pacific (excluding high income)
EAP
false
2
1
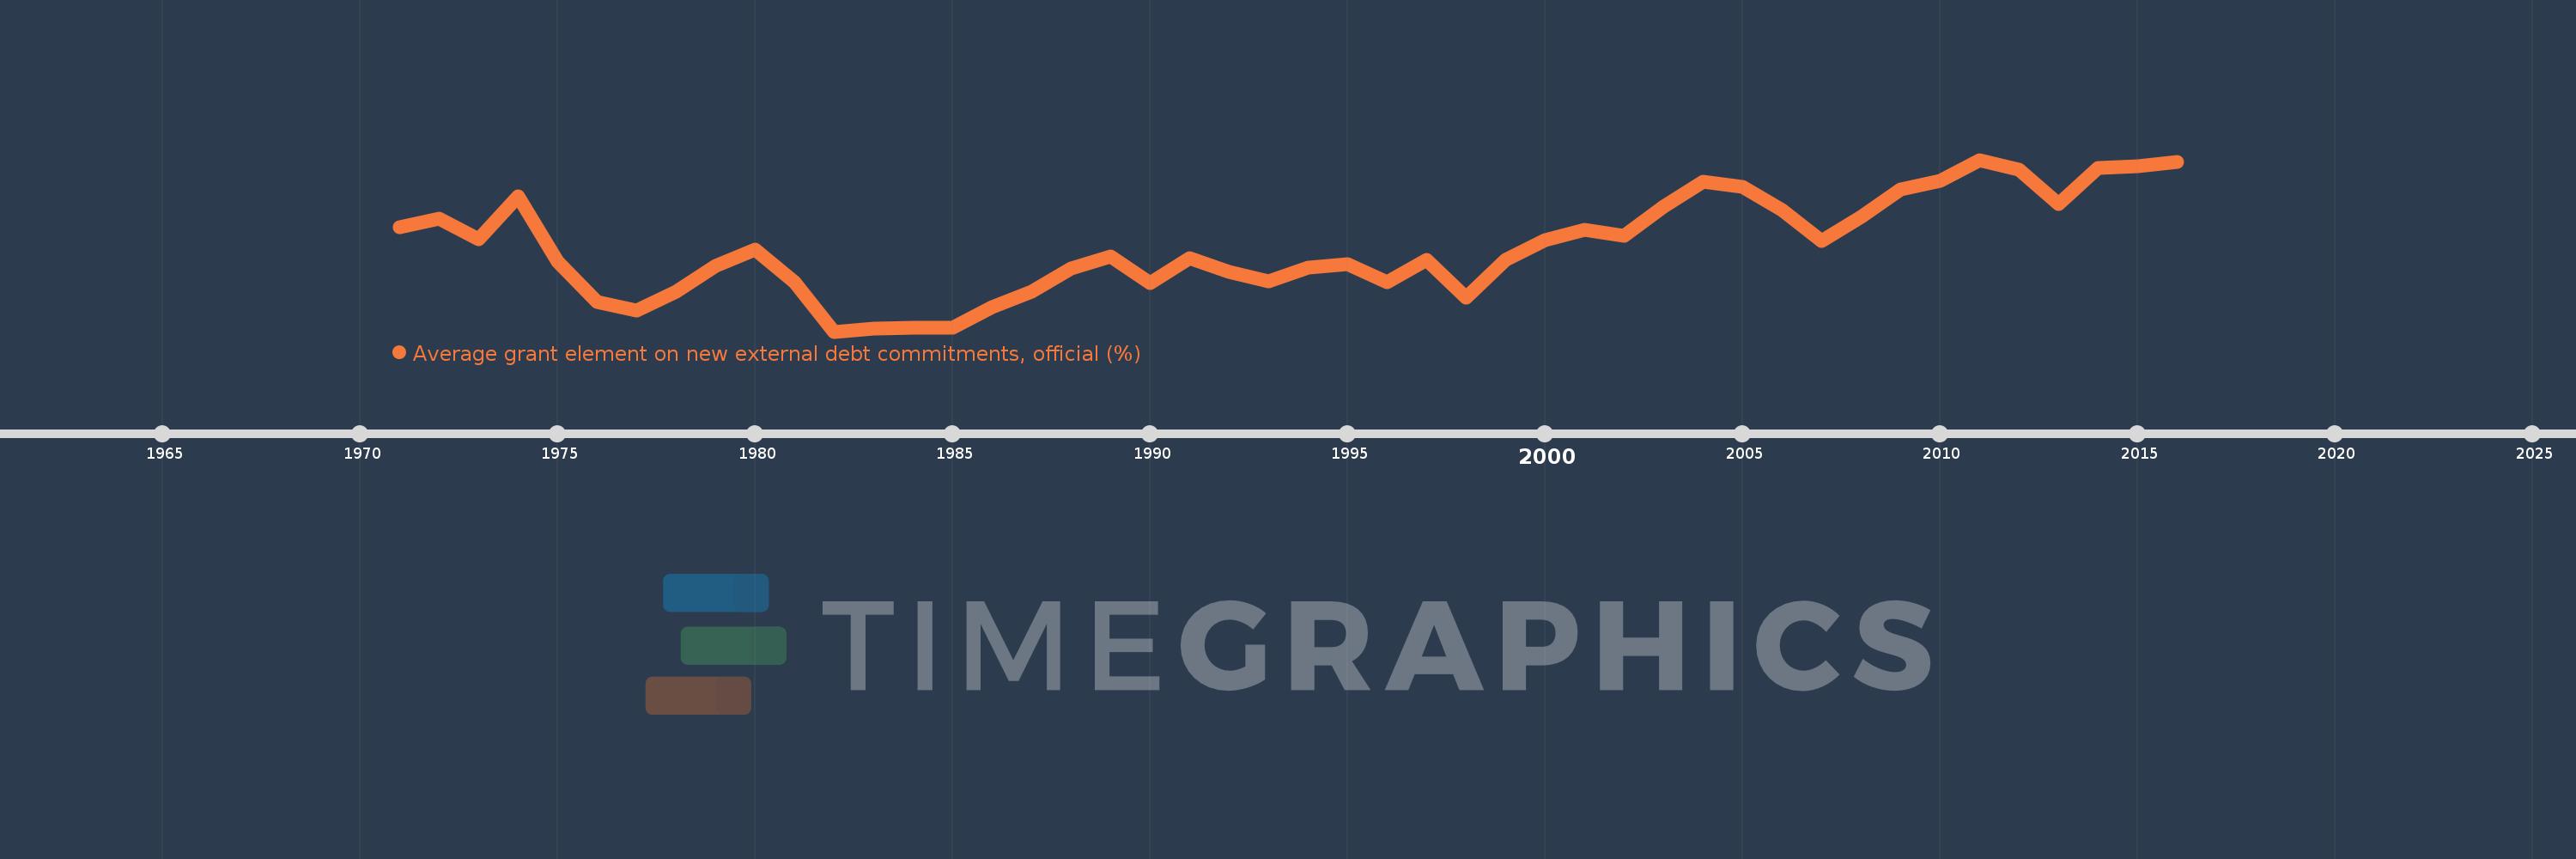
Average grant element on new external debt commitments, official (%)
2016,2015,2014,2013,2012,2011,2010,2009,2008,2007,2006,2005,2004,2003,2002,2001,2000,1999,1998,1997,1996,1995,1994,1993,1992,1991,1990,1989,1988,1987,1986,1985,1984,1983,1982,1981,1980,1979,1978,1977,1976,1975,1974,1973,1972,1971
Estas estadísticas en otros países:
línea de tiempo (timeline):
En esta escala de tiempo se presenta un gráfico de 1971 y 2016 de East Asia & Pacific (excluding high income). Los datos de 1970 están ausentes. El número de observaciones reales por fecha: 46.
Fuente (nombre):
Indicadores del desarrollo mundial
Fuente (organización):
World Bank, International Debt Statistics.
Categorías:
External Debt
Se ha actualizado:
23 abr 2017 año
Los indicadores de los cambios de valor en los últimos años
Mínimo:
20.273
1 ene 1982 año
Máximo:
63.57
1 ene 2011 año
A la fecha de observación
Valor
Cambio absoluto
El cambio con respecto al valor anterior
1 ene 1971 año
46.506
+46.506
0.0%
1 ene 1972 año
48.714
+2.208
4.75%
1 ene 1973 año
43.568
-5.147
-10.56%
1 ene 1974 año
54.374
+10.806
24.8%
1 ene 1975 año
37.856
-16.518
-30.38%
1 ene 1976 año
27.812
-10.044
-26.53%
1 ene 1977 año
25.491
-2.321
-8.35%
1 ene 1978 año
30.243
+4.752
18.64%
1 ene 1979 año
36.741
+6.498
21.48%
1 ene 1980 año
40.982
+4.241
11.54%
1 ene 1981 año
32.628
-8.354
-20.38%
1 ene 1982 año
20.273
-12.356
-37.87%
1 ene 1983 año
20.937
+0.664
3.27%
1 ene 1984 año
21.307
+0.37
1.77%
1 ene 1985 año
21.235
-0.073
-0.34%
1 ene 1986 año
26.398
+5.163
24.32%
1 ene 1987 año
30.304
+3.906
14.8%
1 ene 1988 año
36.263
+5.959
19.67%
1 ene 1989 año
39.162
+2.899
7.99%
1 ene 1990 año
32.569
-6.593
-16.84%
1 ene 1991 año
38.801
+6.232
19.13%
1 ene 1992 año
35.37
-3.431
-8.84%
1 ene 1993 año
32.954
-2.416
-6.83%
1 ene 1994 año
36.445
+3.491
10.59%
1 ene 1995 año
37.258
+0.813
2.23%
1 ene 1996 año
32.676
-4.581
-12.3%
1 ene 1997 año
38.376
+5.7
17.44%
1 ene 1998 año
28.897
-9.479
-24.7%
1 ene 1999 año
38.381
+9.483
32.82%
1 ene 2000 año
43.364
+4.984
12.98%
1 ene 2001 año
45.899
+2.535
5.84%
1 ene 2002 año
44.312
-1.586
-3.46%
1 ene 2003 año
51.711
+7.399
16.7%
1 ene 2004 año
58.001
+6.29
12.16%
1 ene 2005 año
56.775
-1.226
-2.11%
1 ene 2006 año
50.959
-5.816
-10.24%
1 ene 2007 año
43.156
-7.803
-15.31%
1 ene 2008 año
49.137
+5.981
13.86%
1 ene 2009 año
56.108
+6.972
14.19%
1 ene 2010 año
58.165
+2.057
3.67%
1 ene 2011 año
63.57
+5.405
9.29%
1 ene 2012 año
61.035
-2.536
-3.99%
1 ene 2013 año
52.374
-8.661
-14.19%
1 ene 2014 año
61.443
+9.07
17.32%
1 ene 2015 año
62.04
+0.596
0.97%
1 ene 2016 año
62.984
+0.944
1.52%
Ranking de los países por los datos estadísticos actuales


Comentarios: