29
/es/
es
AIzaSyAYiBZKx7MnpbEhh9jyipgxe19OcubqV5w
April 1, 2024
102159
Central African Republic
CAF
true
2
1
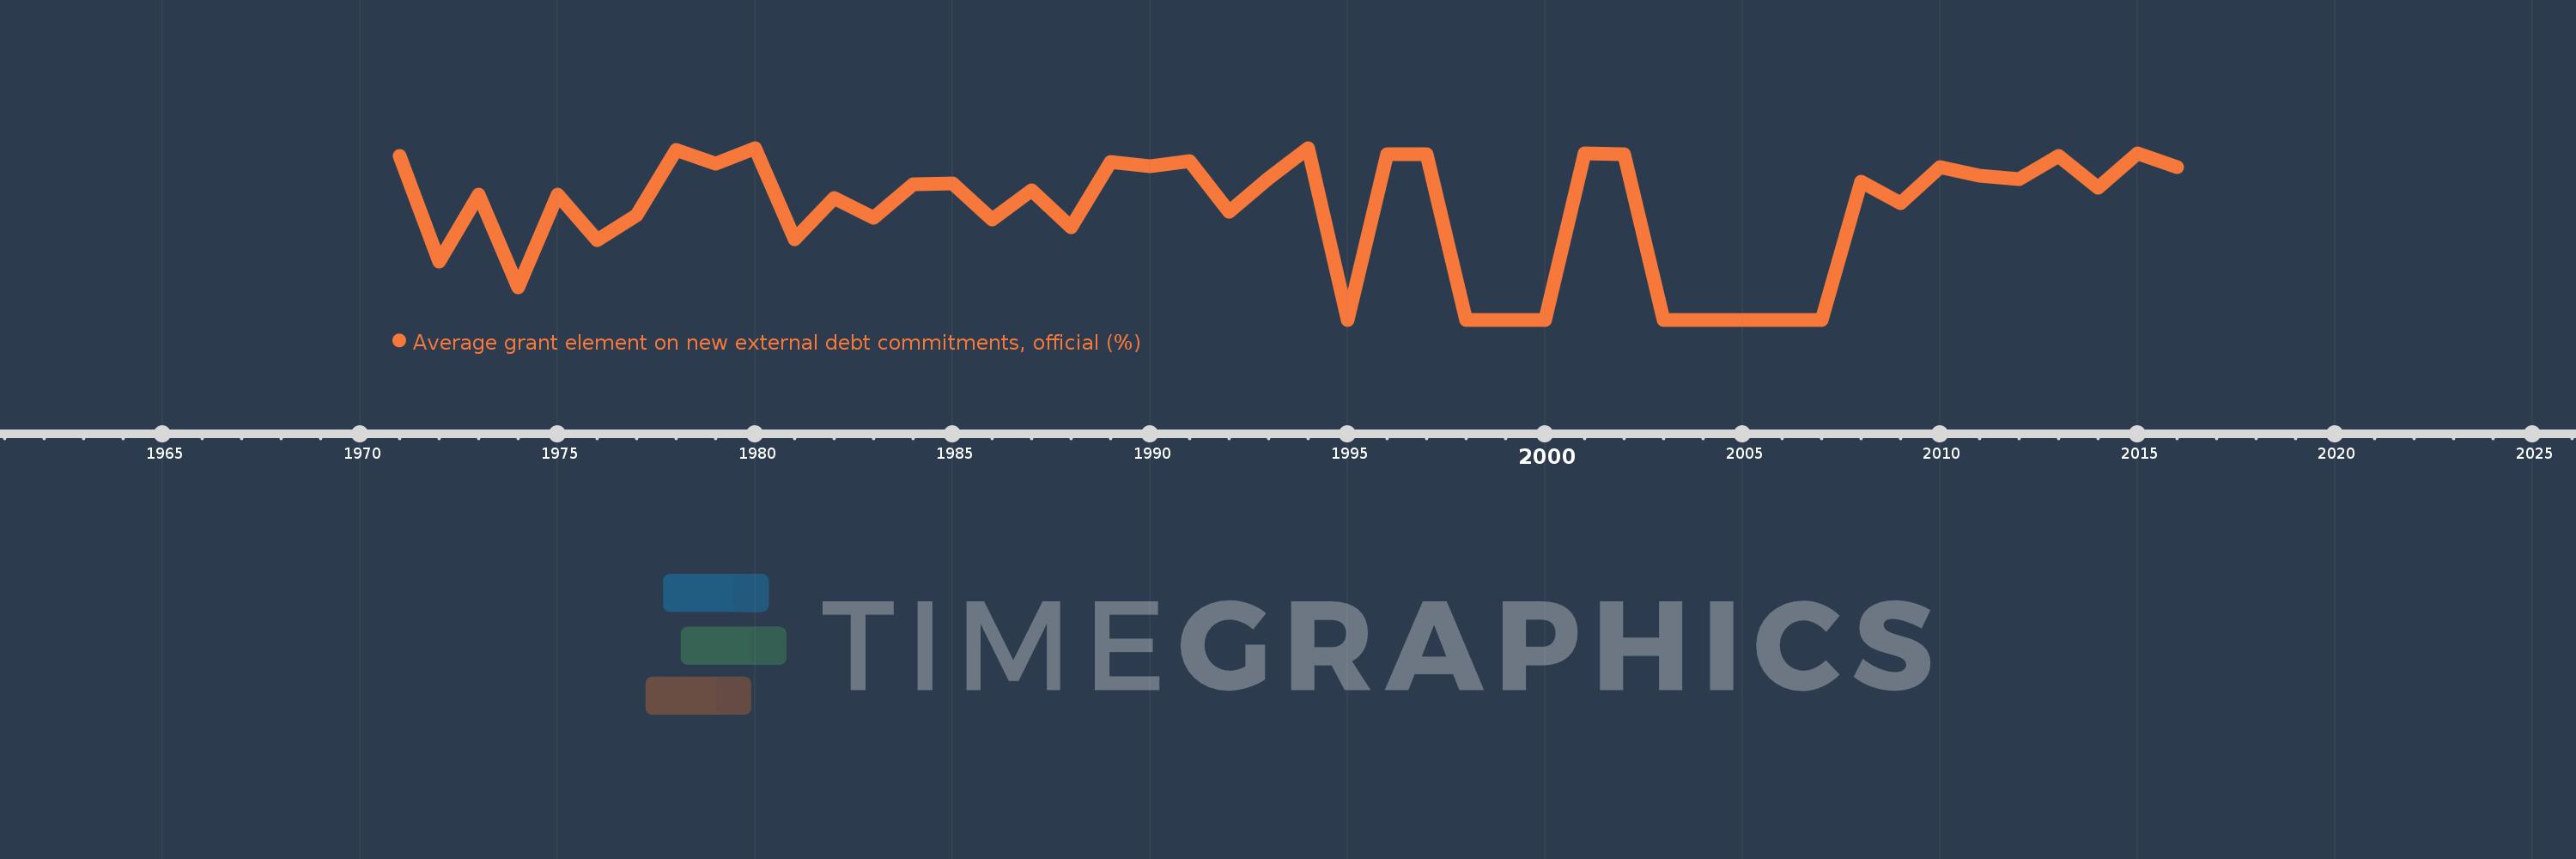
Average grant element on new external debt commitments, official (%)
2016,2015,2014,2013,2012,2011,2010,2009,2008,2007,2006,2005,2004,2003,2002,2001,2000,1999,1998,1997,1996,1995,1994,1993,1992,1991,1990,1989,1988,1987,1986,1985,1984,1983,1982,1981,1980,1979,1978,1977,1976,1975,1974,1973,1972,1971
Estas estadísticas en otros países:
línea de tiempo (timeline):
En esta escala de tiempo se presenta un gráfico de 1971 y 2016 de Central African Republic. Los datos de 1970 están ausentes. El número de observaciones reales por fecha: 46.
Fuente (nombre):
Indicadores del desarrollo mundial
Fuente (organización):
World Bank, International Debt Statistics.
Categorías:
External Debt
Se ha actualizado:
23 abr 2017 año
Los indicadores de los cambios de valor en los últimos años
Máximo:
83.407
1 ene 1980 año
A la fecha de observación
Valor
Cambio absoluto
El cambio con respecto al valor anterior
1 ene 1971 año
79.561
+79.561
0.0%
1 ene 1972 año
28.217
-51.345
-64.53%
1 ene 1973 año
60.813
+32.596
115.52%
1 ene 1974 año
15.928
-44.885
-73.81%
1 ene 1975 año
60.884
+44.957
282.25%
1 ene 1976 año
38.717
-22.168
-36.41%
1 ene 1977 año
50.859
+12.142
31.36%
1 ene 1978 año
82.476
+31.617
62.17%
1 ene 1979 año
75.766
-6.709
-8.14%
1 ene 1980 año
83.407
+7.641
10.08%
1 ene 1981 año
38.965
-44.442
-53.28%
1 ene 1982 año
59.204
+20.239
51.94%
1 ene 1983 año
49.324
-9.88
-16.69%
1 ene 1984 año
65.694
+16.37
33.19%
1 ene 1985 año
66.141
+0.447
0.68%
1 ene 1986 año
48.826
-17.315
-26.18%
1 ene 1987 año
62.864
+14.037
28.75%
1 ene 1988 año
44.907
-17.956
-28.56%
1 ene 1989 año
76.796
+31.888
71.01%
1 ene 1990 año
74.323
-2.473
-3.22%
1 ene 1991 año
77.04
+2.717
3.66%
1 ene 1992 año
52.623
-24.417
-31.69%
1 ene 1993 año
68.512
+15.889
30.2%
1 ene 1994 año
83.218
+14.706
21.47%
1 ene 1995 año
0.0
-83.218
-100.0%
1 ene 1996 año
80.49
+80.49
%
1 ene 1997 año
80.211
-0.278
-0.35%
1 ene 1998 año
0.0
-80.211
-100.0%
1 ene 2001 año
80.635
+80.635
%
1 ene 2002 año
80.301
-0.334
-0.41%
1 ene 2003 año
0.0
-80.301
-100.0%
1 ene 2008 año
67.169
+67.169
%
1 ene 2009 año
56.632
-10.537
-15.69%
1 ene 2010 año
74.147
+17.515
30.93%
1 ene 2011 año
69.827
-4.32
-5.83%
1 ene 2012 año
68.4
-1.427
-2.04%
1 ene 2013 año
79.514
+11.115
16.25%
1 ene 2014 año
63.999
-15.515
-19.51%
1 ene 2015 año
80.627
+16.627
25.98%
1 ene 2016 año
73.929
-6.697
-8.31%
Ranking de los países por los datos estadísticos actuales


Comentarios: