29
/es/
es
AIzaSyAYiBZKx7MnpbEhh9jyipgxe19OcubqV5w
April 1, 2024
276333
United States
USA
true
2
1
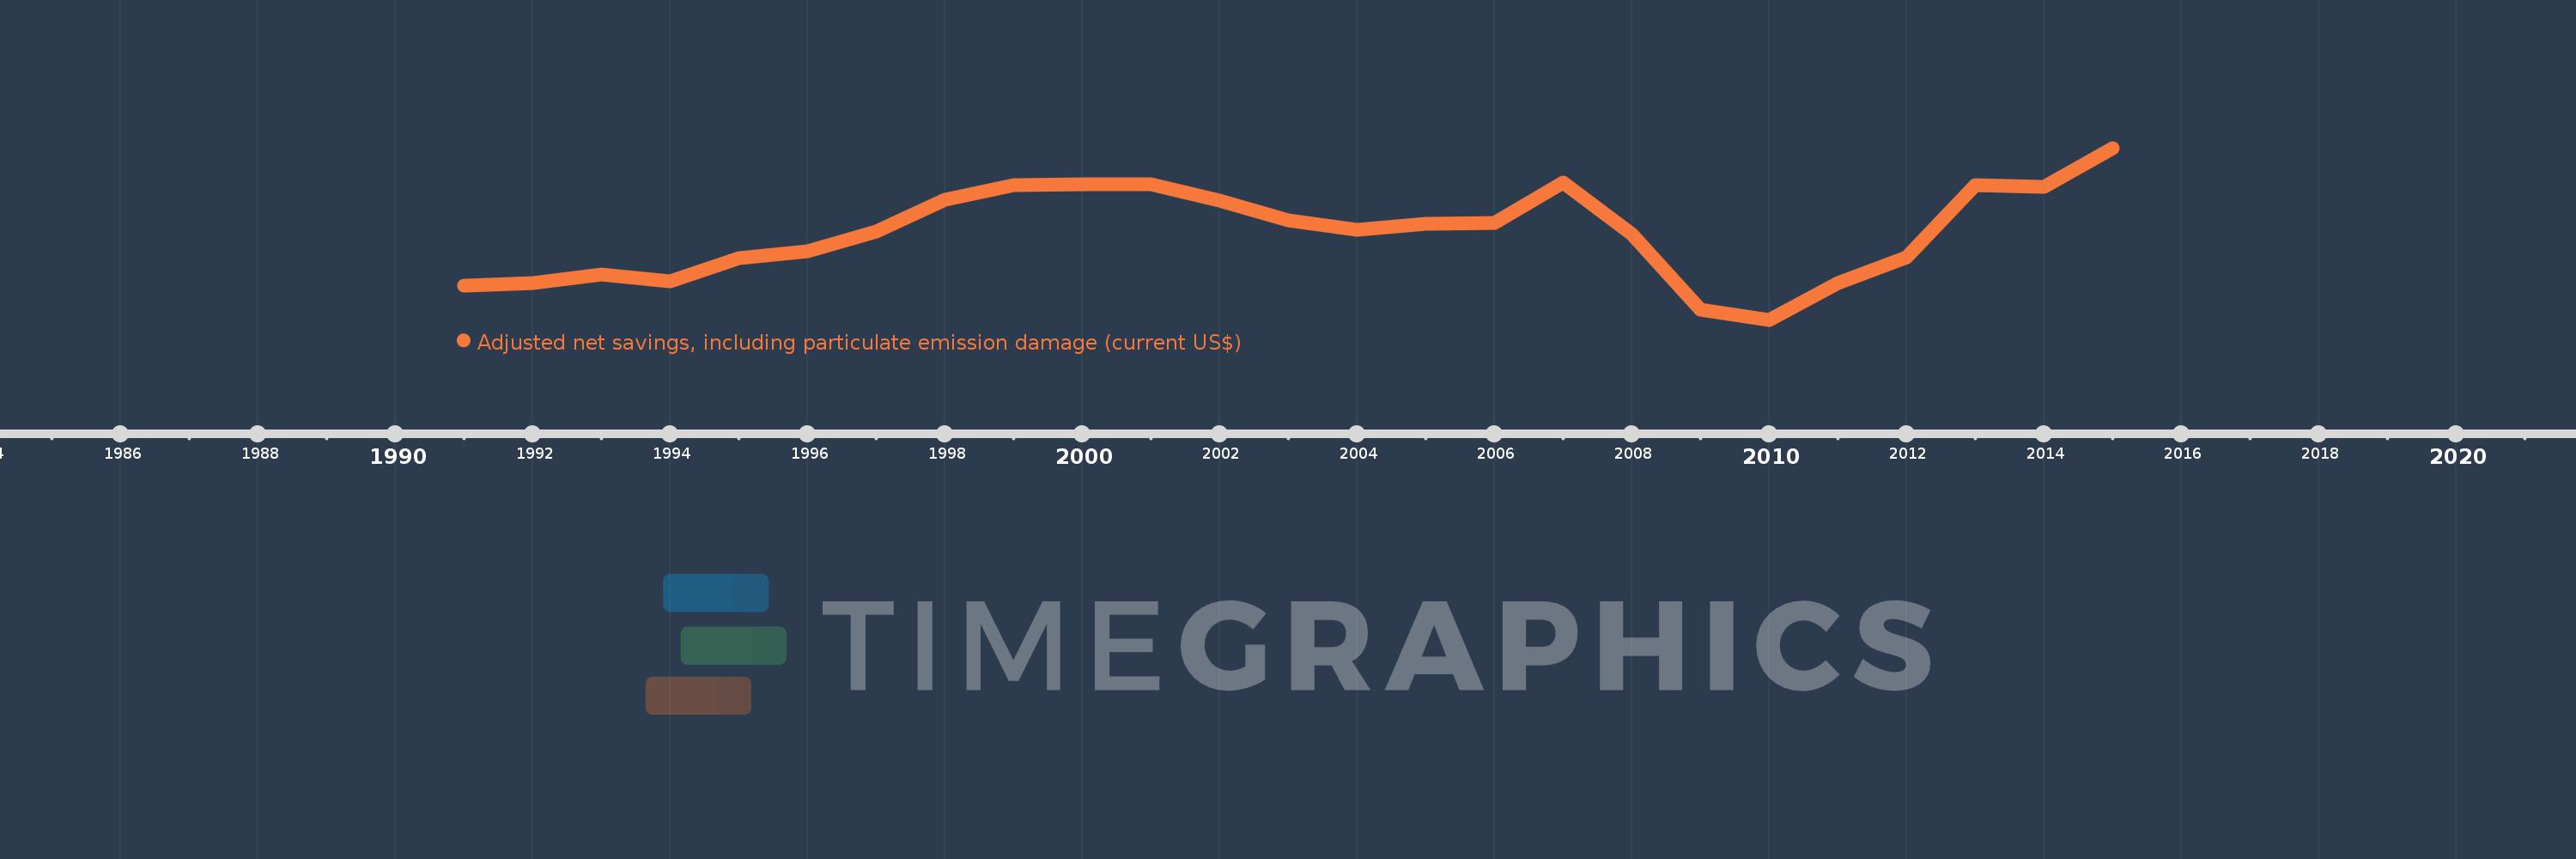
Adjusted net savings, including particulate emission damage (current US$)
2015,2014,2013,2012,2011,2010,2009,2008,2007,2006,2005,2004,2003,2002,2001,2000,1999,1998,1997,1996,1995,1994,1993,1992,1991
Estas estadísticas en otros países:
AfghanistanAlbaniaAlgeriaAngolaArgentinaArmeniaAustraliaAustriaAzerbaijanBahamas, TheBahrainBangladeshBarbadosBelarusBelgiumBelizeBeninBhutanBoliviaBotswanaBrazilBrunei DarussalamBulgariaBurkina FasoBurundiCabo VerdeCambodiaCameroonCanadaCentral African RepublicChadChileChinaColombiaComorosCongo, Dem. Rep.Congo, Rep.Costa RicaCote d'IvoireCroatiaCyprusCzech RepublicDenmarkDominican RepublicEcuadorEgypt, Arab Rep.El SalvadorEquatorial GuineaEritreaEstoniaEthiopiaFijiFinlandFranceGabonGambia, TheGeorgiaGermanyGhanaGreeceGuatemalaGuineaGuinea-BissauGuyanaHaitiHondurasHungaryIcelandIndiaIndonesiaIran, Islamic Rep.IraqIrelandIsraelItalyJamaicaJapanJordanKazakhstanKenyaKorea, Rep.KuwaitKyrgyz RepublicLao PDRLatviaLebanonLesothoLiberiaLibyaLithuaniaLuxembourgMacedonia, FYRMadagascarMalawiMalaysiaMaldivesMaliMauritaniaMauritiusMexicoMoldovaMongoliaMoroccoMozambiqueNamibiaNepalNetherlandsNew ZealandNicaraguaNigerNigeriaNorwayOmanPakistanPanamaPapua New GuineaParaguayPeruPhilippinesPolandPortugalQatarRomaniaRussian FederationRwandaSaudi ArabiaSenegalSierra LeoneSingaporeSlovak RepublicSloveniaSolomon IslandsSouth AfricaSpainSri LankaSudanSurinameSwazilandSwedenSwitzerlandSyrian Arab RepublicTajikistanTanzaniaThailandTogoTrinidad and TobagoTunisiaTurkeyUgandaUkraineUnited KingdomUnited StatesUruguayVenezuela, RBVietnamYemen, Rep.ZambiaZimbabwe línea de tiempo (timeline):
En esta escala de tiempo se presenta un gráfico de 1991 y 2015 de United States. Los datos de 1990 están ausentes. El número de observaciones reales por fecha: 25.
Fuente (nombre):
Indicadores del desarrollo mundial
Fuente (organización):
World Bank staff estimates based on sources and methods in World Bank's "The Changing Wealth of Nations: Measuring Sustainable Development in the New Millennium" (2011).
Categorías:
Economy & Growth, Environment
Se ha actualizado:
23 abr 2017 año
Los indicadores de los cambios de valor en los últimos años
Mínimo:
224.51 bn
1 ene 2010 año
Máximo:
1.144 billones
1 ene 2015 año
A la fecha de observación
Valor
Cambio absoluto
El cambio con respecto al valor anterior
1 ene 1991 año
405.042 bn
+405.042 bn
0.0%
1 ene 1992 año
422.73 bn
+17.688 bn
4.37%
1 ene 1993 año
468.238 bn
+45.508 bn
10.77%
1 ene 1994 año
432.05 bn
-36.188 bn
-7.73%
1 ene 1995 año
554.325 bn
+122.274 bn
28.3%
1 ene 1996 año
591.783 bn
+37.459 bn
6.76%
1 ene 1997 año
697.101 bn
+105.317 bn
17.8%
1 ene 1998 año
864.727 bn
+167.627 bn
24.05%
1 ene 1999 año
944.171 bn
+79.443 bn
9.19%
1 ene 2000 año
949.894 bn
+5.723 bn
0.61%
1 ene 2001 año
951.58 bn
+1.686 bn
0.18%
1 ene 2002 año
863.464 bn
-88.116 bn
-9.26%
1 ene 2003 año
755.936 bn
-107.528 bn
-12.45%
1 ene 2004 año
703.826 bn
-52.11 bn
-6.89%
1 ene 2005 año
738.269 bn
+34.443 bn
4.89%
1 ene 2006 año
740.938 bn
+2.669 bn
0.36%
1 ene 2007 año
957.954 bn
+217.016 bn
29.29%
1 ene 2008 año
681.2 bn
-276.754 bn
-28.89%
1 ene 2009 año
279.496 bn
-401.703 bn
-58.97%
1 ene 2010 año
224.51 bn
-54.987 bn
-19.67%
1 ene 2011 año
423.042 bn
+198.532 bn
88.43%
1 ene 2012 año
560.279 bn
+137.237 bn
32.44%
1 ene 2013 año
944.343 bn
+384.064 bn
68.55%
1 ene 2014 año
934.928 bn
-9.415 bn
-1.0%
1 ene 2015 año
1.144 billones
+209.034 bn
22.36%
Ranking de los países por los datos estadísticos actuales


Comentarios: