29
/es/
es
AIzaSyAYiBZKx7MnpbEhh9jyipgxe19OcubqV5w
April 1, 2024
160179
Israel
ISR
true
2
1
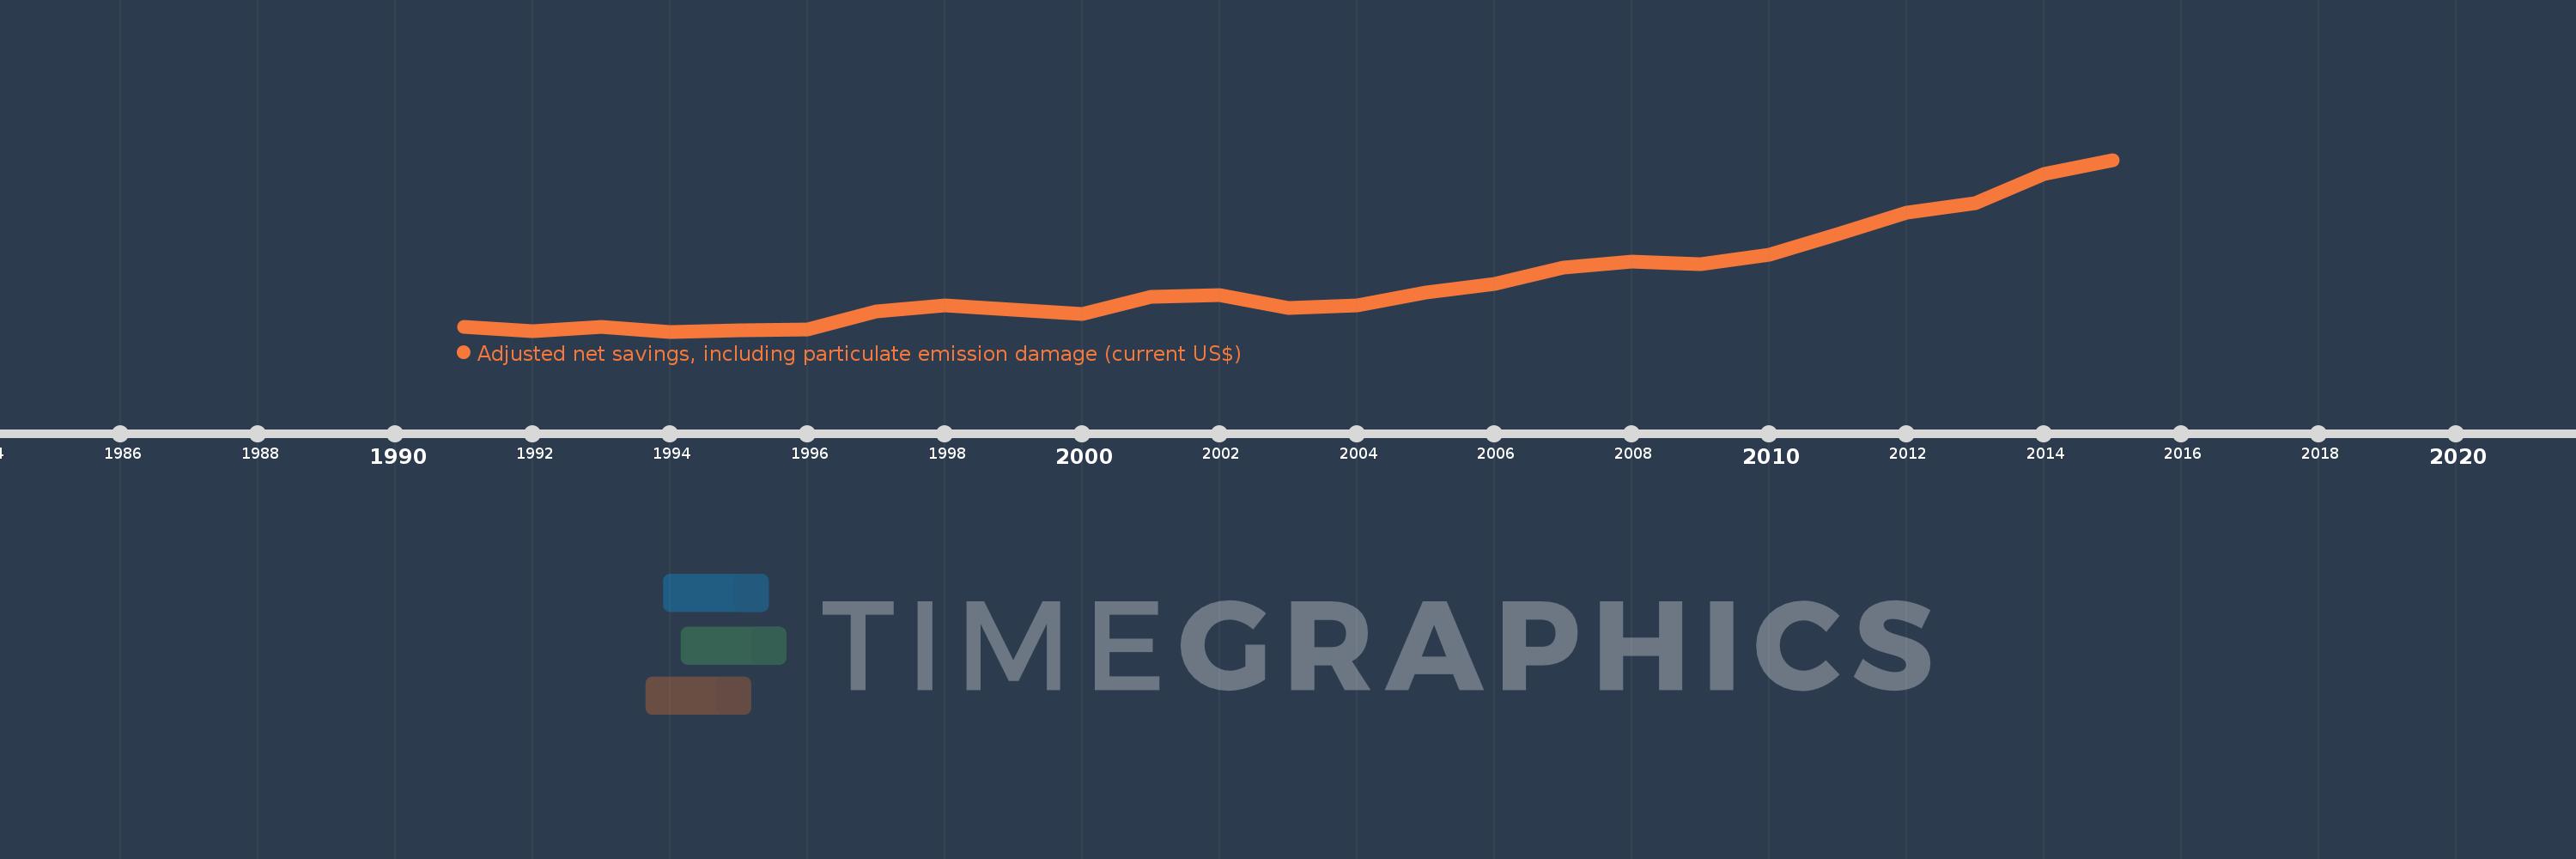
Adjusted net savings, including particulate emission damage (current US$)
2015,2014,2013,2012,2011,2010,2009,2008,2007,2006,2005,2004,2003,2002,2001,2000,1999,1998,1997,1996,1995,1994,1993,1992,1991
Estas estadísticas en otros países:
AfghanistanAlbaniaAlgeriaAngolaArgentinaArmeniaAustraliaAustriaAzerbaijanBahamas, TheBahrainBangladeshBarbadosBelarusBelgiumBelizeBeninBhutanBoliviaBotswanaBrazilBrunei DarussalamBulgariaBurkina FasoBurundiCabo VerdeCambodiaCameroonCanadaCentral African RepublicChadChileChinaColombiaComorosCongo, Dem. Rep.Congo, Rep.Costa RicaCote d'IvoireCroatiaCyprusCzech RepublicDenmarkDominican RepublicEcuadorEgypt, Arab Rep.El SalvadorEquatorial GuineaEritreaEstoniaEthiopiaFijiFinlandFranceGabonGambia, TheGeorgiaGermanyGhanaGreeceGuatemalaGuineaGuinea-BissauGuyanaHaitiHondurasHungaryIcelandIndiaIndonesiaIran, Islamic Rep.IraqIrelandIsraelItalyJamaicaJapanJordanKazakhstanKenyaKorea, Rep.KuwaitKyrgyz RepublicLao PDRLatviaLebanonLesothoLiberiaLibyaLithuaniaLuxembourgMacedonia, FYRMadagascarMalawiMalaysiaMaldivesMaliMauritaniaMauritiusMexicoMoldovaMongoliaMoroccoMozambiqueNamibiaNepalNetherlandsNew ZealandNicaraguaNigerNigeriaNorwayOmanPakistanPanamaPapua New GuineaParaguayPeruPhilippinesPolandPortugalQatarRomaniaRussian FederationRwandaSaudi ArabiaSenegalSierra LeoneSingaporeSlovak RepublicSloveniaSolomon IslandsSouth AfricaSpainSri LankaSudanSurinameSwazilandSwedenSwitzerlandSyrian Arab RepublicTajikistanTanzaniaThailandTogoTrinidad and TobagoTunisiaTurkeyUgandaUkraineUnited KingdomUnited StatesUruguayVenezuela, RBVietnamYemen, Rep.ZambiaZimbabwe línea de tiempo (timeline):
En esta escala de tiempo se presenta un gráfico de 1991 y 2015 de Israel. Los datos de 1990 están ausentes. El número de observaciones reales por fecha: 25.
Fuente (nombre):
Indicadores del desarrollo mundial
Fuente (organización):
World Bank staff estimates based on sources and methods in World Bank's "The Changing Wealth of Nations: Measuring Sustainable Development in the New Millennium" (2011).
Categorías:
Economy & Growth, Environment
Se ha actualizado:
23 abr 2017 año
Los indicadores de los cambios de valor en los últimos años
Mínimo:
5.442 bn
1 ene 1994 año
Máximo:
46.075 bn
1 ene 2015 año
A la fecha de observación
Valor
Cambio absoluto
El cambio con respecto al valor anterior
1 ene 1991 año
6.554 bn
+6.554 bn
0.0%
1 ene 1992 año
5.567 bn
-987.572 millones
-15.07%
1 ene 1993 año
6.627 bn
+1.061 bn
19.06%
1 ene 1994 año
5.442 bn
-1.186 bn
-17.89%
1 ene 1995 año
5.829 bn
+387.493 millones
7.12%
1 ene 1996 año
6.019 bn
+189.439 millones
3.25%
1 ene 1997 año
10.19 bn
+4.172 bn
69.32%
1 ene 1998 año
11.651 bn
+1.461 bn
14.34%
1 ene 1999 año
10.716 bn
-935.68 millones
-8.03%
1 ene 2000 año
9.573 bn
-1.143 bn
-10.67%
1 ene 2001 año
13.684 bn
+4.111 bn
42.95%
1 ene 2002 año
14.173 bn
+488.501 millones
3.57%
1 ene 2003 año
11.093 bn
-3.08 bn
-21.73%
1 ene 2004 año
11.538 bn
+444.94 millones
4.01%
1 ene 2005 año
14.717 bn
+3.18 bn
27.56%
1 ene 2006 año
16.779 bn
+2.062 bn
14.01%
1 ene 2007 año
20.597 bn
+3.817 bn
22.75%
1 ene 2008 año
22.053 bn
+1.456 bn
7.07%
1 ene 2009 año
21.403 bn
-649.306 millones
-2.94%
1 ene 2010 año
23.564 bn
+2.161 bn
10.1%
1 ene 2011 año
28.499 bn
+4.934 bn
20.94%
1 ene 2012 año
33.509 bn
+5.01 bn
17.58%
1 ene 2013 año
35.812 bn
+2.303 bn
6.87%
1 ene 2014 año
42.716 bn
+6.904 bn
19.28%
1 ene 2015 año
46.075 bn
+3.359 bn
7.86%
Ranking de los países por los datos estadísticos actuales


Comentarios: