29
/es/
es
AIzaSyAYiBZKx7MnpbEhh9jyipgxe19OcubqV5w
April 1, 2024
275080
United Arab Emirates
ARE
true
2
1
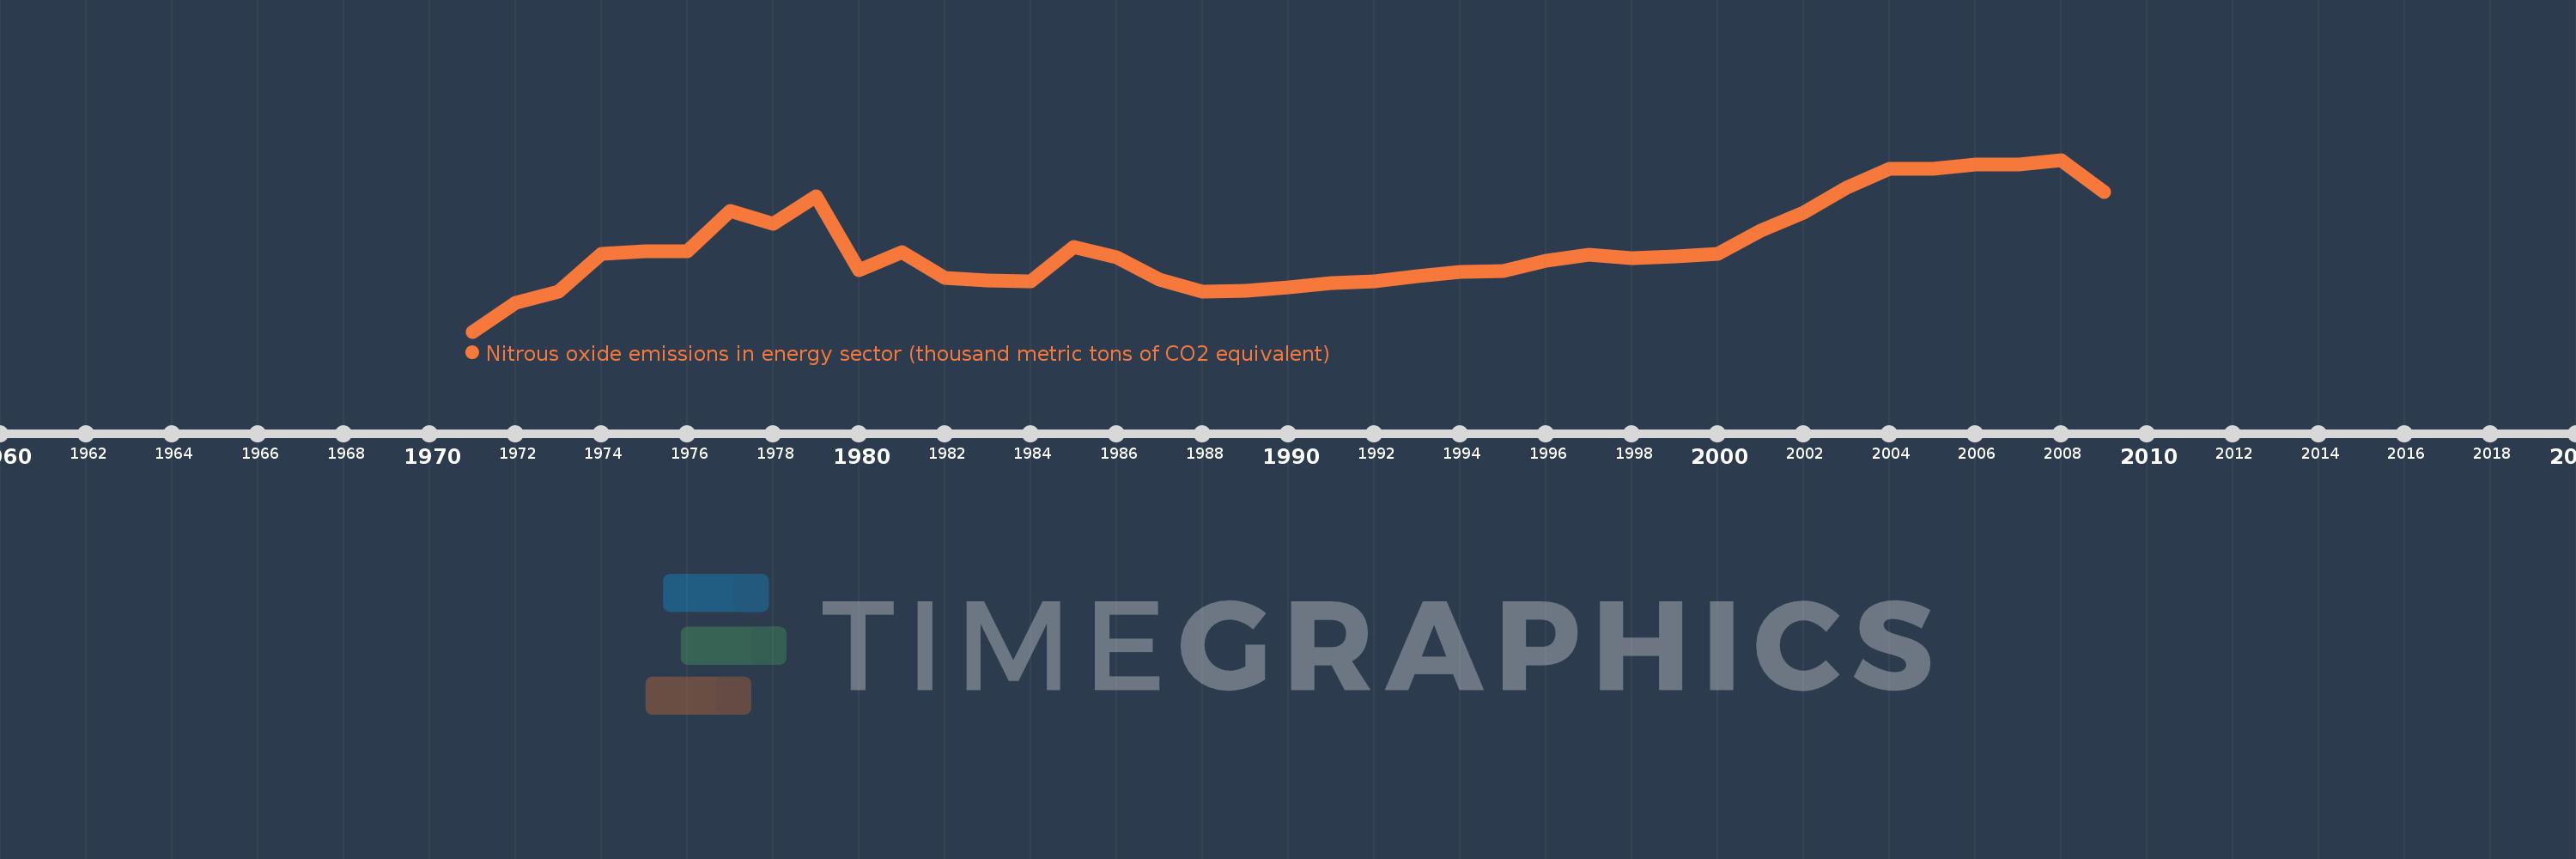
Nitrous oxide emissions in energy sector (thousand metric tons of CO2 equivalent)
2009,2008,2007,2006,2005,2004,2003,2002,2001,2000,1999,1998,1997,1996,1995,1994,1993,1992,1991,1990,1989,1988,1987,1986,1985,1984,1983,1982,1981,1980,1979,1978,1977,1976,1975,1974,1973,1972,1971
Estas estadísticas en otros países:
AfghanistanAlbaniaAlgeriaAmerican SamoaAndorraAngolaAntigua and BarbudaArab WorldArgentinaArmeniaArubaAustraliaAustriaAzerbaijanBahamas, TheBahrainBangladeshBarbadosBelarusBelgiumBelizeBeninBermudaBhutanBoliviaBosnia and HerzegovinaBotswanaBrazilBritish Virgin IslandsBrunei DarussalamBulgariaBurkina FasoBurundiCabo VerdeCambodiaCameroonCanadaCaribbean small statesCayman IslandsCentral African RepublicCentral Europe and the BalticsChadChannel IslandsChileChinaColombiaComorosCongo, Dem. Rep.Congo, Rep.Costa RicaCote d'IvoireCroatiaCubaCuracaoCyprusCzech RepublicDenmarkDjiboutiDominicaDominican RepublicEarly-demographic dividendEast Asia & PacificEast Asia & Pacific (excluding high income)East Asia & Pacific (IDA & IBRD countries)EcuadorEgypt, Arab Rep.El SalvadorEquatorial GuineaEritreaEstoniaEthiopiaEuro areaEurope & Central AsiaEurope & Central Asia (excluding high income)Europe & Central Asia (IDA & IBRD countries)European UnionFaroe IslandsFijiFinlandFragile and conflict affected situationsFranceFrench PolynesiaGabonGambia, TheGeorgiaGermanyGhanaGibraltarGreeceGreenlandGrenadaGuamGuatemalaGuineaGuinea-BissauGuyanaHaitiHeavily indebted poor countries (HIPC)High incomeHondurasHong Kong SAR, ChinaHungaryIBRD onlyIcelandIDA & IBRD totalIDA blendIDA onlyIDA totalIndiaIndonesiaIran, Islamic Rep.IraqIrelandIsle of ManIsraelItalyJamaicaJapanJordanKazakhstanKenyaKiribatiKorea, Dem. People’s Rep.Korea, Rep.KosovoKuwaitKyrgyz RepublicLao PDRLate-demographic dividendLatin America & Caribbean Latin America & Caribbean (excluding high income)Latin America & the Caribbean (IDA & IBRD countries)LatviaLeast developed countries: UN classificationLebanonLesothoLiberiaLibyaLiechtensteinLithuaniaLow & middle incomeLow incomeLower middle incomeLuxembourgMacao SAR, ChinaMacedonia, FYRMadagascarMalawiMalaysiaMaldivesMaliMaltaMarshall IslandsMauritaniaMauritiusMexicoMicronesia, Fed. Sts.Middle East & North AfricaMiddle East & North Africa (excluding high income)Middle East & North Africa (IDA & IBRD countries)Middle incomeMoldovaMonacoMongoliaMontenegroMoroccoMozambiqueMyanmarNamibiaNauruNepalNetherlandsNew CaledoniaNew ZealandNicaraguaNigerNigeriaNorth AmericaNorthern Mariana IslandsNorwayOECD membersOmanOther small statesPacific island small statesPakistanPalauPanamaPapua New GuineaParaguayPeruPhilippinesPolandPortugalPost-demographic dividendPre-demographic dividendPuerto RicoQatarRomaniaRussian FederationRwandaSamoaSan MarinoSao Tome and PrincipeSaudi ArabiaSenegalSerbiaSeychellesSierra LeoneSingaporeSint Maarten (Dutch part)Slovak RepublicSloveniaSmall statesSolomon IslandsSomaliaSouth AfricaSouth AsiaSouth Asia (IDA & IBRD)South SudanSpainSri LankaSt. Kitts and NevisSt. LuciaSt. Martin (French part)St. Vincent and the GrenadinesSub-Saharan Africa Sub-Saharan Africa (excluding high income)Sub-Saharan Africa (IDA & IBRD countries)SudanSurinameSwazilandSwedenSwitzerlandSyrian Arab RepublicTajikistanTanzaniaThailandTimor-LesteTogoTongaTrinidad and TobagoTunisiaTurkeyTurkmenistanTurks and Caicos IslandsTuvaluUgandaUkraineUnited Arab EmiratesUnited KingdomUnited StatesUpper middle incomeUruguayUzbekistanVanuatuVenezuela, RBVietnamVirgin Islands (U.S.)West Bank and GazaWorldYemen, Rep.ZambiaZimbabwe línea de tiempo (timeline):
En esta escala de tiempo se presenta un gráfico de 1971 y 2009 de United Arab Emirates. Los datos de 1970 están ausentes. El número de observaciones reales por fecha: 39.
Fuente (nombre):
Indicadores del desarrollo mundial
Fuente (organización):
European Commission, Joint Research Centre (JRC)/Netherlands Environmental Assessment Agency (PBL). Emission Database for Global Atmospheric Research (EDGAR): http://edgar.jrc.ec.europa.eu/
Categorías:
Energy & Mining, Environment
Se ha actualizado:
23 abr 2017 año
Los indicadores de los cambios de valor en los últimos años
Mínimo:
86.424
1 ene 1971 año
Máximo:
238.808
1 ene 2008 año
A la fecha de observación
Valor
Cambio absoluto
El cambio con respecto al valor anterior
1 ene 1971 año
86.424
+86.424
0.0%
1 ene 1972 año
111.832
+25.408
29.4%
1 ene 1973 año
121.914
+10.082
9.02%
1 ene 1974 año
155.586
+33.672
27.62%
1 ene 1975 año
157.439
+1.853
1.19%
1 ene 1976 año
157.501
+0.062
0.04%
1 ene 1977 año
193.147
+35.646
22.63%
1 ene 1978 año
182.047
-11.1
-5.75%
1 ene 1979 año
206.509
+24.462
13.44%
1 ene 1980 año
141.179
-65.33
-31.64%
1 ene 1981 año
156.609
+15.43
10.93%
1 ene 1982 año
133.845
-22.764
-14.54%
1 ene 1983 año
131.911
-1.934
-1.44%
1 ene 1984 año
131.234
-0.677
-0.51%
1 ene 1985 año
161.212
+29.978
22.84%
1 ene 1986 año
152.2
-9.012
-5.59%
1 ene 1987 año
132.672
-19.529
-12.83%
1 ene 1988 año
122.01
-10.661
-8.04%
1 ene 1989 año
122.673
+0.663
0.54%
1 ene 1990 año
126.001
+3.328
2.71%
1 ene 1991 año
129.328
+3.327
2.64%
1 ene 1992 año
130.922
+1.594
1.23%
1 ene 1993 año
135.571
+4.649
3.55%
1 ene 1994 año
139.12
+3.549
2.62%
1 ene 1995 año
139.999
+0.879
0.63%
1 ene 1996 año
149.384
+9.385
6.7%
1 ene 1997 año
154.763
+5.379
3.6%
1 ene 1998 año
151.533
-3.231
-2.09%
1 ene 1999 año
153.394
+1.861
1.23%
1 ene 2000 año
155.692
+2.298
1.5%
1 ene 2001 año
175.69
+19.998
12.84%
1 ene 2002 año
191.717
+16.027
9.12%
1 ene 2003 año
213.77
+22.053
11.5%
1 ene 2004 año
230.683
+16.912
7.91%
1 ene 2005 año
230.693
+0.011
0.0%
1 ene 2006 año
234.311
+3.617
1.57%
1 ene 2007 año
234.48
+0.169
0.07%
1 ene 2008 año
238.808
+4.328
1.85%
1 ene 2009 año
210.0
-28.807
-12.06%
Ranking de los países por los datos estadísticos actuales


Comentarios: