29
/es/
es
AIzaSyAYiBZKx7MnpbEhh9jyipgxe19OcubqV5w
April 1, 2024
261330
Tanzania
TZA
true
2
1
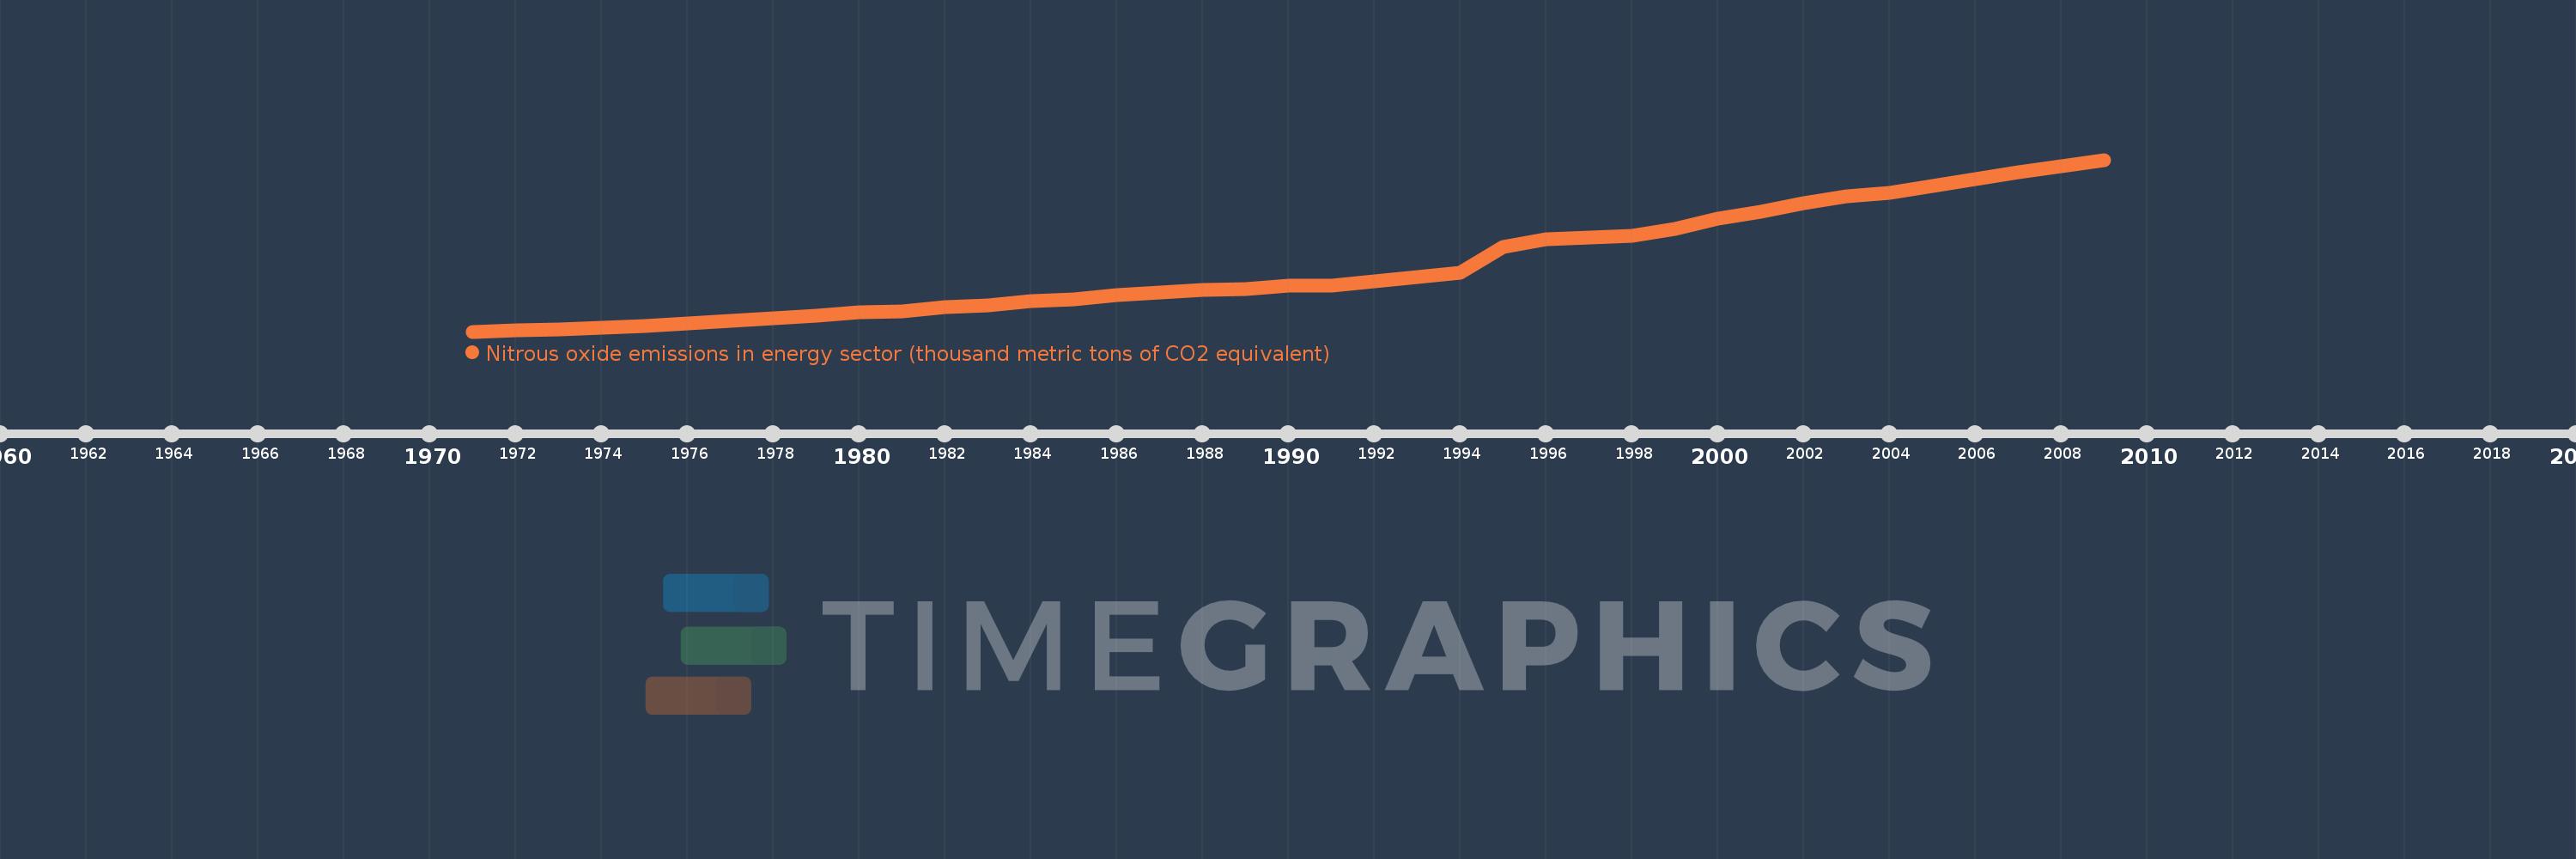
Nitrous oxide emissions in energy sector (thousand metric tons of CO2 equivalent)
2009,2008,2007,2006,2005,2004,2003,2002,2001,2000,1999,1998,1997,1996,1995,1994,1993,1992,1991,1990,1989,1988,1987,1986,1985,1984,1983,1982,1981,1980,1979,1978,1977,1976,1975,1974,1973,1972,1971
Estas estadísticas en otros países:
AfghanistanAlbaniaAlgeriaAmerican SamoaAndorraAngolaAntigua and BarbudaArab WorldArgentinaArmeniaArubaAustraliaAustriaAzerbaijanBahamas, TheBahrainBangladeshBarbadosBelarusBelgiumBelizeBeninBermudaBhutanBoliviaBosnia and HerzegovinaBotswanaBrazilBritish Virgin IslandsBrunei DarussalamBulgariaBurkina FasoBurundiCabo VerdeCambodiaCameroonCanadaCaribbean small statesCayman IslandsCentral African RepublicCentral Europe and the BalticsChadChannel IslandsChileChinaColombiaComorosCongo, Dem. Rep.Congo, Rep.Costa RicaCote d'IvoireCroatiaCubaCuracaoCyprusCzech RepublicDenmarkDjiboutiDominicaDominican RepublicEarly-demographic dividendEast Asia & PacificEast Asia & Pacific (excluding high income)East Asia & Pacific (IDA & IBRD countries)EcuadorEgypt, Arab Rep.El SalvadorEquatorial GuineaEritreaEstoniaEthiopiaEuro areaEurope & Central AsiaEurope & Central Asia (excluding high income)Europe & Central Asia (IDA & IBRD countries)European UnionFaroe IslandsFijiFinlandFragile and conflict affected situationsFranceFrench PolynesiaGabonGambia, TheGeorgiaGermanyGhanaGibraltarGreeceGreenlandGrenadaGuamGuatemalaGuineaGuinea-BissauGuyanaHaitiHeavily indebted poor countries (HIPC)High incomeHondurasHong Kong SAR, ChinaHungaryIBRD onlyIcelandIDA & IBRD totalIDA blendIDA onlyIDA totalIndiaIndonesiaIran, Islamic Rep.IraqIrelandIsle of ManIsraelItalyJamaicaJapanJordanKazakhstanKenyaKiribatiKorea, Dem. People’s Rep.Korea, Rep.KosovoKuwaitKyrgyz RepublicLao PDRLate-demographic dividendLatin America & Caribbean Latin America & Caribbean (excluding high income)Latin America & the Caribbean (IDA & IBRD countries)LatviaLeast developed countries: UN classificationLebanonLesothoLiberiaLibyaLiechtensteinLithuaniaLow & middle incomeLow incomeLower middle incomeLuxembourgMacao SAR, ChinaMacedonia, FYRMadagascarMalawiMalaysiaMaldivesMaliMaltaMarshall IslandsMauritaniaMauritiusMexicoMicronesia, Fed. Sts.Middle East & North AfricaMiddle East & North Africa (excluding high income)Middle East & North Africa (IDA & IBRD countries)Middle incomeMoldovaMonacoMongoliaMontenegroMoroccoMozambiqueMyanmarNamibiaNauruNepalNetherlandsNew CaledoniaNew ZealandNicaraguaNigerNigeriaNorth AmericaNorthern Mariana IslandsNorwayOECD membersOmanOther small statesPacific island small statesPakistanPalauPanamaPapua New GuineaParaguayPeruPhilippinesPolandPortugalPost-demographic dividendPre-demographic dividendPuerto RicoQatarRomaniaRussian FederationRwandaSamoaSan MarinoSao Tome and PrincipeSaudi ArabiaSenegalSerbiaSeychellesSierra LeoneSingaporeSint Maarten (Dutch part)Slovak RepublicSloveniaSmall statesSolomon IslandsSomaliaSouth AfricaSouth AsiaSouth Asia (IDA & IBRD)South SudanSpainSri LankaSt. Kitts and NevisSt. LuciaSt. Martin (French part)St. Vincent and the GrenadinesSub-Saharan Africa Sub-Saharan Africa (excluding high income)Sub-Saharan Africa (IDA & IBRD countries)SudanSurinameSwazilandSwedenSwitzerlandSyrian Arab RepublicTajikistanTanzaniaThailandTimor-LesteTogoTongaTrinidad and TobagoTunisiaTurkeyTurkmenistanTurks and Caicos IslandsTuvaluUgandaUkraineUnited Arab EmiratesUnited KingdomUnited StatesUpper middle incomeUruguayUzbekistanVanuatuVenezuela, RBVietnamVirgin Islands (U.S.)West Bank and GazaWorldYemen, Rep.ZambiaZimbabwe línea de tiempo (timeline):
En esta escala de tiempo se presenta un gráfico de 1971 y 2009 de Tanzania. Los datos de 1970 están ausentes. El número de observaciones reales por fecha: 39.
Fuente (nombre):
Indicadores del desarrollo mundial
Fuente (organización):
European Commission, Joint Research Centre (JRC)/Netherlands Environmental Assessment Agency (PBL). Emission Database for Global Atmospheric Research (EDGAR): http://edgar.jrc.ec.europa.eu/
Categorías:
Energy & Mining, Environment
Se ha actualizado:
23 abr 2017 año
Los indicadores de los cambios de valor en los últimos años
Mínimo:
252.866
1 ene 1971 año
Máximo:
616.177
1 ene 2009 año
A la fecha de observación
Valor
Cambio absoluto
El cambio con respecto al valor anterior
1 ene 1971 año
252.866
+252.866
0.0%
1 ene 1972 año
255.997
+3.131
1.24%
1 ene 1973 año
258.109
+2.112
0.83%
1 ene 1974 año
260.571
+2.462
0.95%
1 ene 1975 año
264.162
+3.591
1.38%
1 ene 1976 año
269.458
+5.296
2.0%
1 ene 1977 año
274.796
+5.338
1.98%
1 ene 1978 año
281.302
+6.506
2.37%
1 ene 1979 año
286.99
+5.688
2.02%
1 ene 1980 año
292.865
+5.876
2.05%
1 ene 1981 año
296.322
+3.456
1.18%
1 ene 1982 año
303.857
+7.535
2.54%
1 ene 1983 año
309.131
+5.274
1.74%
1 ene 1984 año
316.664
+7.533
2.44%
1 ene 1985 año
321.246
+4.582
1.45%
1 ene 1986 año
330.056
+8.81
2.74%
1 ene 1987 año
335.943
+5.887
1.78%
1 ene 1988 año
341.517
+5.574
1.66%
1 ene 1989 año
342.758
+1.241
0.36%
1 ene 1990 año
349.431
+6.674
1.95%
1 ene 1991 año
350.143
+0.711
0.2%
1 ene 1992 año
358.415
+8.272
2.36%
1 ene 1993 año
367.818
+9.404
2.62%
1 ene 1994 año
377.258
+9.439
2.57%
1 ene 1995 año
431.066
+53.808
14.26%
1 ene 1996 año
448.649
+17.583
4.08%
1 ene 1997 año
451.442
+2.793
0.62%
1 ene 1998 año
454.612
+3.17
0.7%
1 ene 1999 año
469.504
+14.892
3.28%
1 ene 2000 año
490.995
+21.491
4.58%
1 ene 2001 año
507.145
+16.15
3.29%
1 ene 2002 año
523.591
+16.446
3.24%
1 ene 2003 año
539.343
+15.752
3.01%
1 ene 2004 año
545.674
+6.332
1.17%
1 ene 2005 año
561.667
+15.993
2.93%
1 ene 2006 año
575.73
+14.063
2.5%
1 ene 2007 año
590.223
+14.493
2.52%
1 ene 2008 año
602.849
+12.626
2.14%
1 ene 2009 año
616.177
+13.328
2.21%
Ranking de los países por los datos estadísticos actuales


Comentarios: