29
/es/
es
AIzaSyAYiBZKx7MnpbEhh9jyipgxe19OcubqV5w
April 1, 2024
274565
United Arab Emirates
ARE
true
2
1
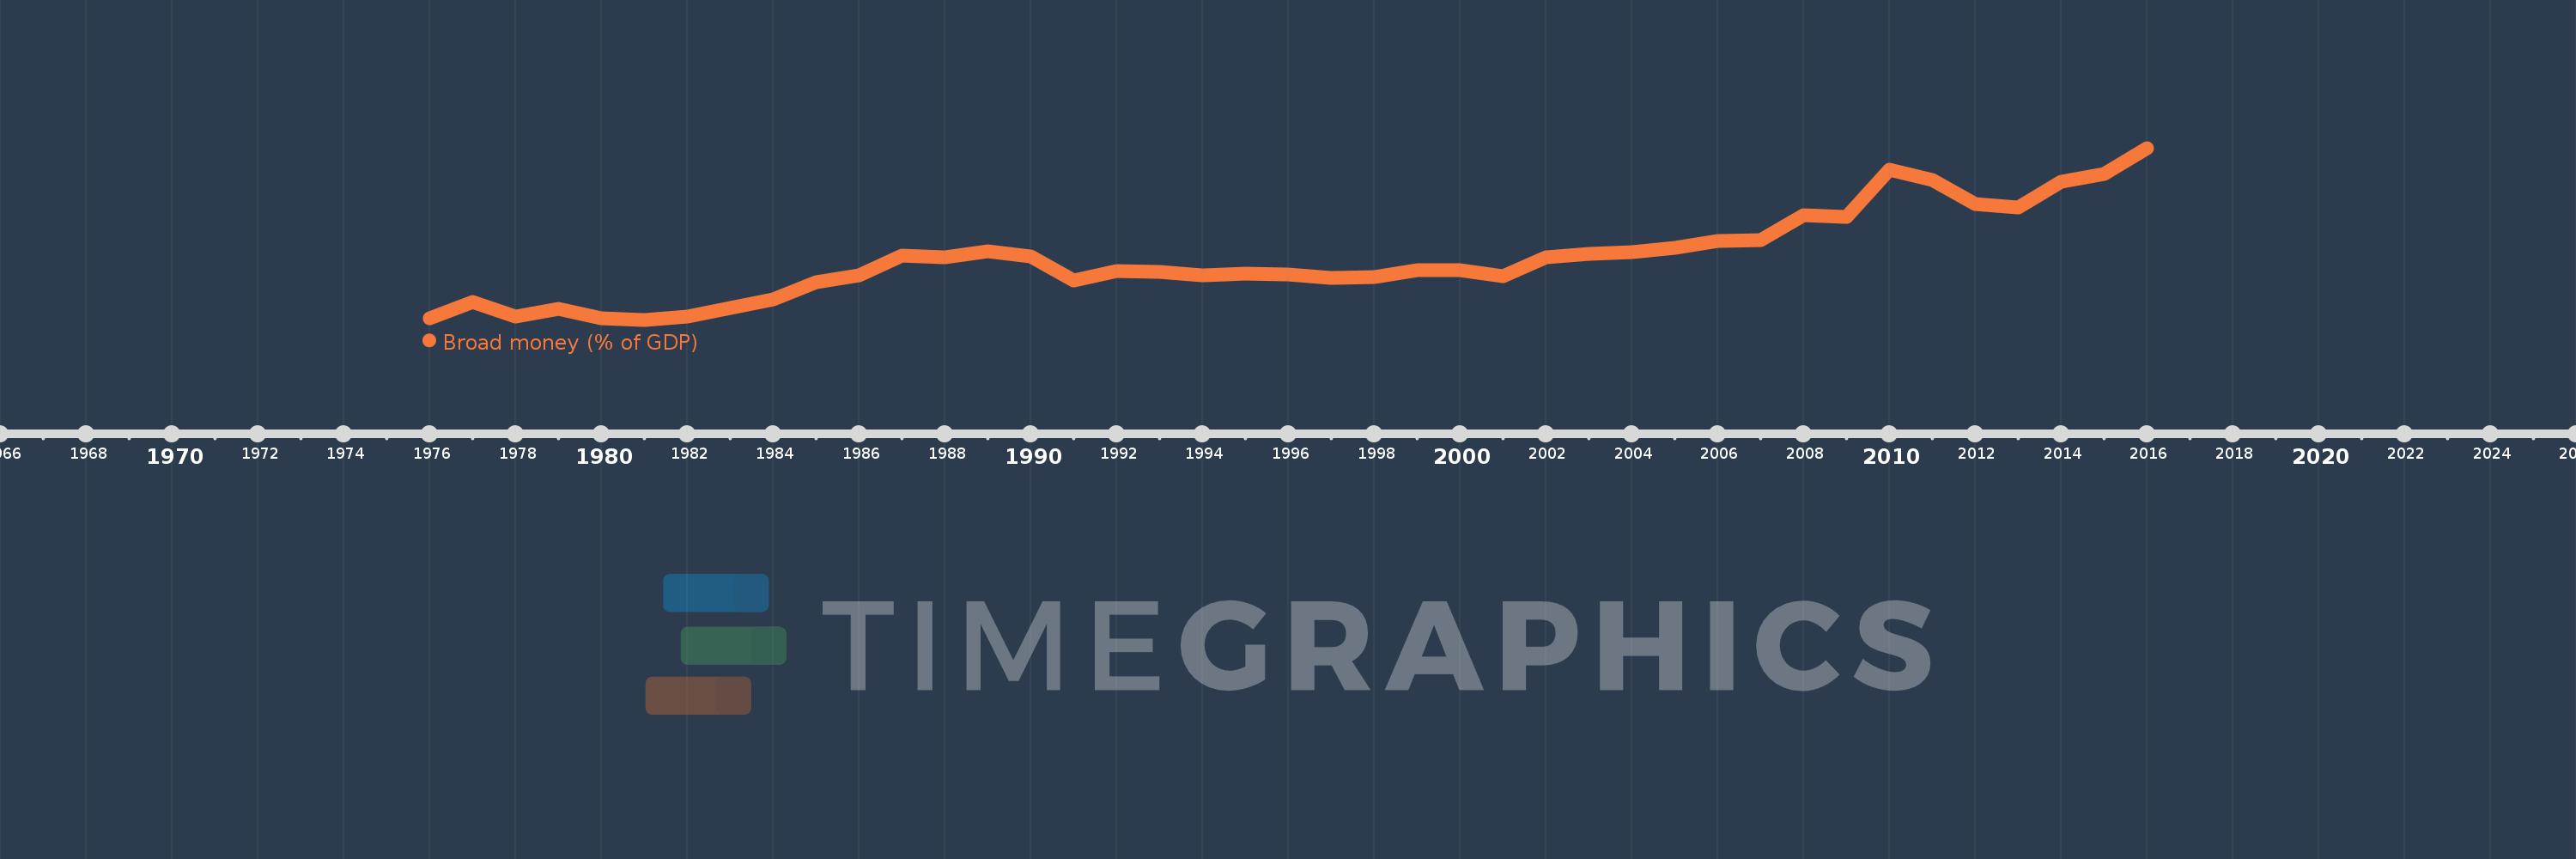
Broad money (% of GDP)
2016,2015,2014,2013,2012,2011,2010,2009,2008,2007,2006,2005,2004,2003,2002,2001,2000,1999,1998,1997,1996,1995,1994,1993,1992,1991,1990,1989,1988,1987,1986,1985,1984,1983,1982,1981,1980,1979,1978,1977,1976
Estas estadísticas en otros países:
AfghanistanAlbaniaAlgeriaAngolaAntigua and BarbudaArab WorldArgentinaArmeniaArubaAustraliaAzerbaijanBahamas, TheBahrainBangladeshBarbadosBelarusBelizeBeninBhutanBoliviaBosnia and HerzegovinaBotswanaBrazilBrunei DarussalamBulgariaBurkina FasoBurundiCabo VerdeCambodiaCameroonCanadaCaribbean small statesCentral African RepublicCentral Europe and the BalticsChadChileChinaColombiaComorosCongo, Dem. Rep.Congo, Rep.Costa RicaCote d'IvoireCroatiaCzech RepublicDenmarkDjiboutiDominicaDominican RepublicEarly-demographic dividendEast Asia & PacificEast Asia & Pacific (excluding high income)East Asia & Pacific (IDA & IBRD countries)EcuadorEgypt, Arab Rep.El SalvadorEquatorial GuineaEritreaEstoniaEthiopiaEurope & Central Asia (excluding high income)Europe & Central Asia (IDA & IBRD countries)FijiFragile and conflict affected situationsGabonGambia, TheGeorgiaGhanaGrenadaGuatemalaGuineaGuinea-BissauGuyanaHaitiHeavily indebted poor countries (HIPC)High incomeHondurasHong Kong SAR, ChinaHungaryIBRD onlyIcelandIDA & IBRD totalIDA blendIDA onlyIDA totalIndiaIndonesiaIran, Islamic Rep.IraqIsraelJamaicaJapanJordanKazakhstanKenyaKorea, Rep.KuwaitKyrgyz RepublicLao PDRLate-demographic dividendLatin America & Caribbean Latin America & Caribbean (excluding high income)Latin America & the Caribbean (IDA & IBRD countries)LatviaLeast developed countries: UN classificationLebanonLesothoLiberiaLibyaLithuaniaLow & middle incomeLow incomeLower middle incomeMacao SAR, ChinaMacedonia, FYRMadagascarMalawiMalaysiaMaldivesMaliMauritaniaMauritiusMexicoMicronesia, Fed. Sts.Middle East & North AfricaMiddle East & North Africa (excluding high income)Middle East & North Africa (IDA & IBRD countries)Middle incomeMoldovaMongoliaMoroccoMozambiqueMyanmarNamibiaNepalNew ZealandNicaraguaNigerNigeriaNorth AmericaNorwayOECD membersOmanOther small statesPacific island small statesPakistanPanamaPapua New GuineaParaguayPeruPhilippinesPolandPost-demographic dividendPre-demographic dividendQatarRomaniaRussian FederationRwandaSamoaSao Tome and PrincipeSaudi ArabiaSenegalSerbiaSeychellesSierra LeoneSingaporeSlovak RepublicSmall statesSolomon IslandsSouth AfricaSouth AsiaSouth Asia (IDA & IBRD)South SudanSri LankaSt. Kitts and NevisSt. LuciaSt. Vincent and the GrenadinesSub-Saharan Africa Sub-Saharan Africa (excluding high income)Sub-Saharan Africa (IDA & IBRD countries)SudanSurinameSwazilandSwedenSwitzerlandSyrian Arab RepublicTajikistanTanzaniaThailandTimor-LesteTogoTongaTrinidad and TobagoTunisiaTurkeyUgandaUkraineUnited Arab EmiratesUnited KingdomUnited StatesUpper middle incomeUruguayVanuatuVenezuela, RBVietnamWest Bank and GazaWorldYemen, Rep.ZambiaZimbabwe línea de tiempo (timeline):
En esta escala de tiempo se presenta un gráfico de 1976 y 2016 de United Arab Emirates. Los datos de 1975 están ausentes. El número de observaciones reales por fecha: 41.
Fuente (nombre):
Indicadores del desarrollo mundial
Fuente (organización):
International Monetary Fund, International Financial Statistics and data files, and World Bank and OECD GDP estimates.
Categorías:
Financial Sector
Se ha actualizado:
23 abr 2017 año
Los indicadores de los cambios de valor en los últimos años
Mínimo:
14.555
1 ene 1981 año
Máximo:
87.272
1 ene 2016 año
A la fecha de observación
Valor
Cambio absoluto
El cambio con respecto al valor anterior
1 ene 1976 año
15.126
+15.126
0.0%
1 ene 1977 año
22.058
+6.933
45.83%
1 ene 1978 año
16.007
-6.052
-27.44%
1 ene 1979 año
19.096
+3.089
19.3%
1 ene 1980 año
15.294
-3.801
-19.91%
1 ene 1981 año
14.555
-0.739
-4.83%
1 ene 1982 año
16.065
+1.51
10.37%
1 ene 1983 año
19.659
+3.594
22.37%
1 ene 1984 año
23.128
+3.47
17.65%
1 ene 1985 año
30.539
+7.41
32.04%
1 ene 1986 año
33.468
+2.93
9.59%
1 ene 1987 año
41.792
+8.324
24.87%
1 ene 1988 año
41.132
-0.66
-1.58%
1 ene 1989 año
43.671
+2.539
6.17%
1 ene 1990 año
41.512
-2.16
-4.95%
1 ene 1991 año
31.166
-10.345
-24.92%
1 ene 1992 año
35.109
+3.943
12.65%
1 ene 1993 año
34.911
-0.199
-0.57%
1 ene 1994 año
33.504
-1.407
-4.03%
1 ene 1995 año
33.907
+0.403
1.2%
1 ene 1996 año
33.711
-0.195
-0.58%
1 ene 1997 año
32.191
-1.52
-4.51%
1 ene 1998 año
32.757
+0.566
1.76%
1 ene 1999 año
35.545
+2.788
8.51%
1 ene 2000 año
35.501
-0.043
-0.12%
1 ene 2001 año
33.136
-2.366
-6.66%
1 ene 2002 año
40.809
+7.674
23.16%
1 ene 2003 año
42.432
+1.623
3.98%
1 ene 2004 año
43.16
+0.728
1.72%
1 ene 2005 año
44.924
+1.764
4.09%
1 ene 2006 año
48.035
+3.111
6.93%
1 ene 2007 año
48.165
+0.129
0.27%
1 ene 2008 año
58.652
+10.487
21.77%
1 ene 2009 año
58.151
-0.501
-0.85%
1 ene 2010 año
78.199
+20.049
34.48%
1 ene 2011 año
73.665
-4.534
-5.8%
1 ene 2012 año
63.531
-10.134
-13.76%
1 ene 2013 año
61.954
-1.577
-2.48%
1 ene 2014 año
73.077
+11.123
17.95%
1 ene 2015 año
76.239
+3.162
4.33%
1 ene 2016 año
87.272
+11.033
14.47%
Ranking de los países por los datos estadísticos actuales


Comentarios: