29
/es/
es
AIzaSyAYiBZKx7MnpbEhh9jyipgxe19OcubqV5w
April 1, 2024
203892
Myanmar
MMR
true
2
1
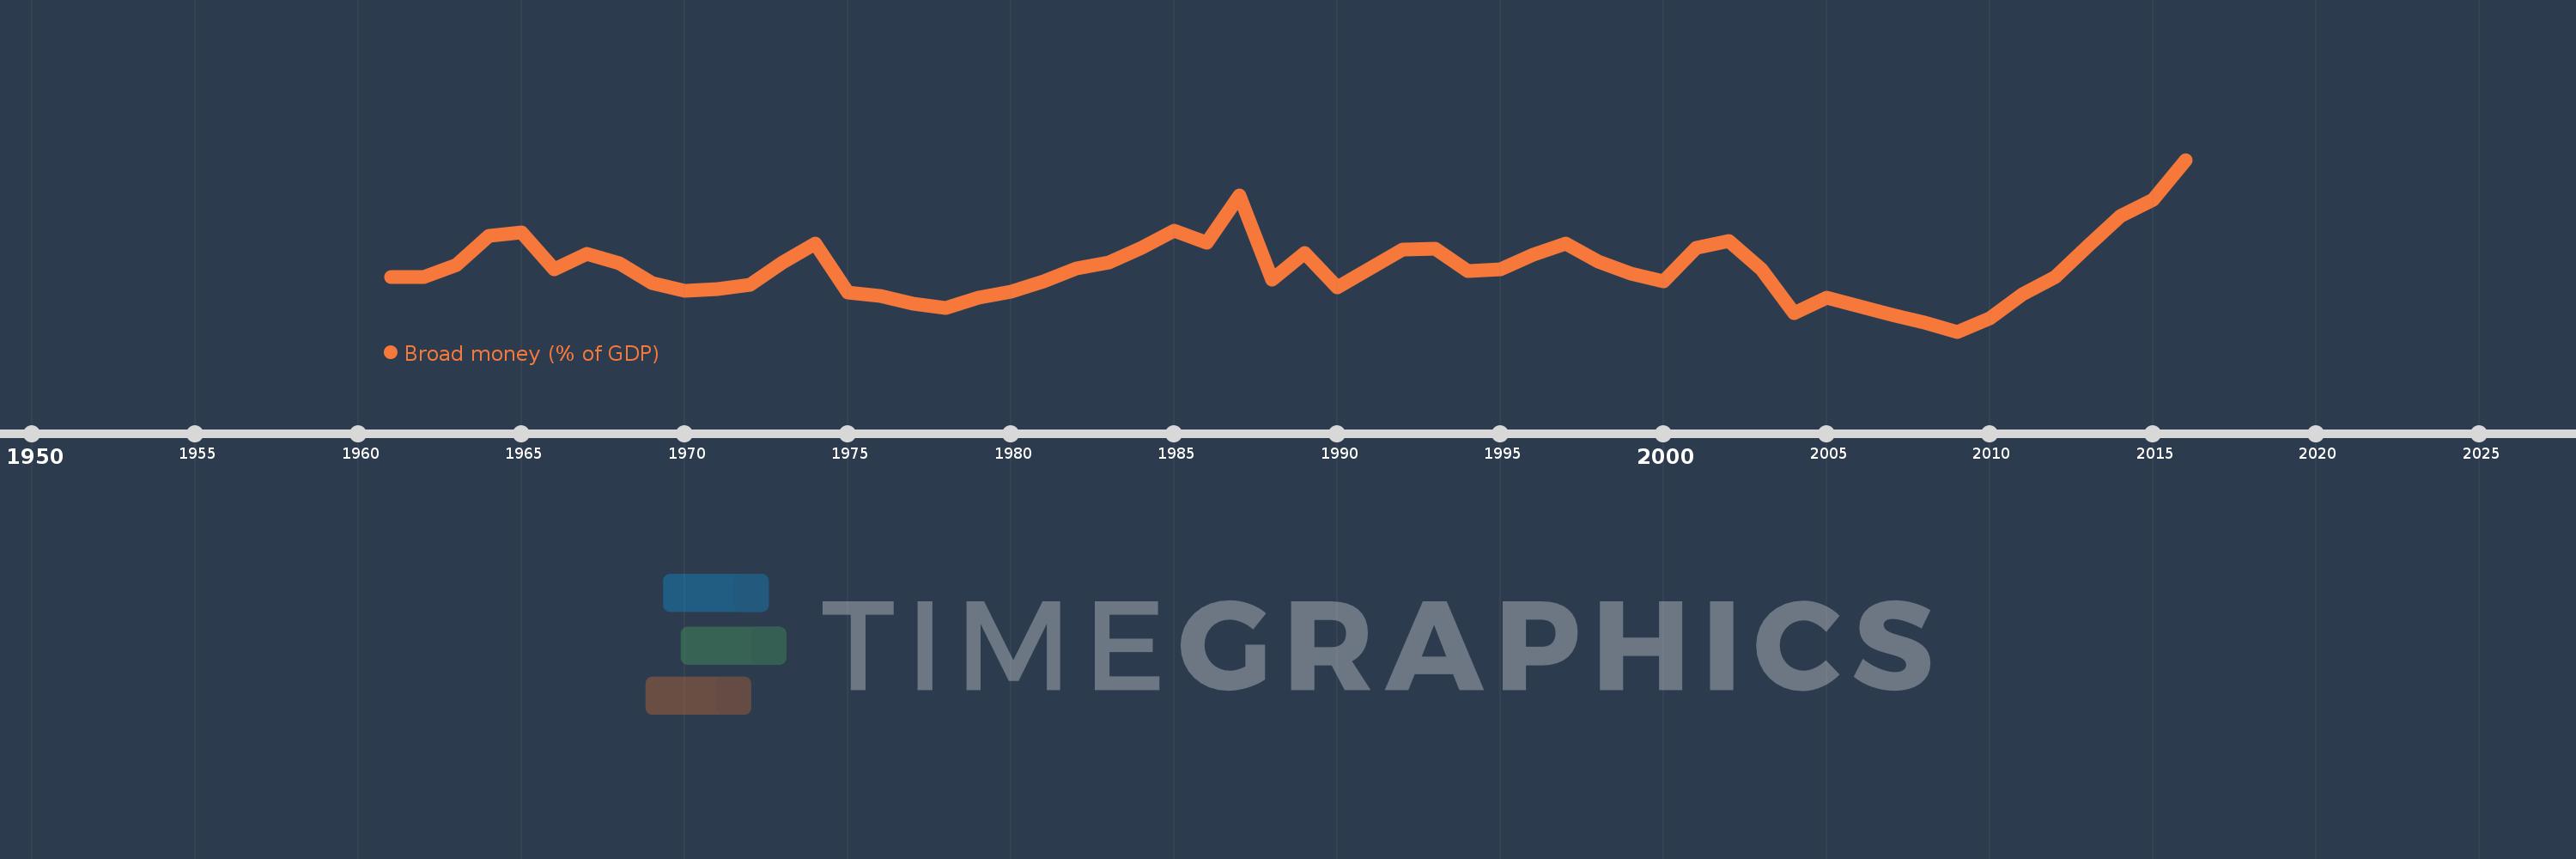
Broad money (% of GDP)
2016,2015,2014,2013,2012,2011,2010,2009,2008,2007,2006,2005,2004,2003,2002,2001,2000,1999,1998,1997,1996,1995,1994,1993,1992,1991,1990,1989,1988,1987,1986,1985,1984,1983,1982,1981,1980,1979,1978,1977,1976,1975,1974,1973,1972,1971,1970,1969,1968,1967,1966,1965,1964,1963,1962,1961
Estas estadísticas en otros países:
AfghanistanAlbaniaAlgeriaAngolaAntigua and BarbudaArab WorldArgentinaArmeniaArubaAustraliaAzerbaijanBahamas, TheBahrainBangladeshBarbadosBelarusBelizeBeninBhutanBoliviaBosnia and HerzegovinaBotswanaBrazilBrunei DarussalamBulgariaBurkina FasoBurundiCabo VerdeCambodiaCameroonCanadaCaribbean small statesCentral African RepublicCentral Europe and the BalticsChadChileChinaColombiaComorosCongo, Dem. Rep.Congo, Rep.Costa RicaCote d'IvoireCroatiaCzech RepublicDenmarkDjiboutiDominicaDominican RepublicEarly-demographic dividendEast Asia & PacificEast Asia & Pacific (excluding high income)East Asia & Pacific (IDA & IBRD countries)EcuadorEgypt, Arab Rep.El SalvadorEquatorial GuineaEritreaEstoniaEthiopiaEurope & Central Asia (excluding high income)Europe & Central Asia (IDA & IBRD countries)FijiFragile and conflict affected situationsGabonGambia, TheGeorgiaGhanaGrenadaGuatemalaGuineaGuinea-BissauGuyanaHaitiHeavily indebted poor countries (HIPC)High incomeHondurasHong Kong SAR, ChinaHungaryIBRD onlyIcelandIDA & IBRD totalIDA blendIDA onlyIDA totalIndiaIndonesiaIran, Islamic Rep.IraqIsraelJamaicaJapanJordanKazakhstanKenyaKorea, Rep.KuwaitKyrgyz RepublicLao PDRLate-demographic dividendLatin America & Caribbean Latin America & Caribbean (excluding high income)Latin America & the Caribbean (IDA & IBRD countries)LatviaLeast developed countries: UN classificationLebanonLesothoLiberiaLibyaLithuaniaLow & middle incomeLow incomeLower middle incomeMacao SAR, ChinaMacedonia, FYRMadagascarMalawiMalaysiaMaldivesMaliMauritaniaMauritiusMexicoMicronesia, Fed. Sts.Middle East & North AfricaMiddle East & North Africa (excluding high income)Middle East & North Africa (IDA & IBRD countries)Middle incomeMoldovaMongoliaMoroccoMozambiqueMyanmarNamibiaNepalNew ZealandNicaraguaNigerNigeriaNorth AmericaNorwayOECD membersOmanOther small statesPacific island small statesPakistanPanamaPapua New GuineaParaguayPeruPhilippinesPolandPost-demographic dividendPre-demographic dividendQatarRomaniaRussian FederationRwandaSamoaSao Tome and PrincipeSaudi ArabiaSenegalSerbiaSeychellesSierra LeoneSingaporeSlovak RepublicSmall statesSolomon IslandsSouth AfricaSouth AsiaSouth Asia (IDA & IBRD)South SudanSri LankaSt. Kitts and NevisSt. LuciaSt. Vincent and the GrenadinesSub-Saharan Africa Sub-Saharan Africa (excluding high income)Sub-Saharan Africa (IDA & IBRD countries)SudanSurinameSwazilandSwedenSwitzerlandSyrian Arab RepublicTajikistanTanzaniaThailandTimor-LesteTogoTongaTrinidad and TobagoTunisiaTurkeyUgandaUkraineUnited Arab EmiratesUnited KingdomUnited StatesUpper middle incomeUruguayVanuatuVenezuela, RBVietnamWest Bank and GazaWorldYemen, Rep.ZambiaZimbabwe línea de tiempo (timeline):
En esta escala de tiempo se presenta un gráfico de 1961 y 2016 de Myanmar. Los datos de 1960 están ausentes. El número de observaciones reales por fecha: 56.
Fuente (nombre):
Indicadores del desarrollo mundial
Fuente (organización):
International Monetary Fund, International Financial Statistics and data files, and World Bank and OECD GDP estimates.
Categorías:
Financial Sector
Se ha actualizado:
23 abr 2017 año
Los indicadores de los cambios de valor en los últimos años
Mínimo:
17.229
1 ene 2009 año
Máximo:
46.33
1 ene 2016 año
A la fecha de observación
Valor
Cambio absoluto
El cambio con respecto al valor anterior
1 ene 1961 año
26.401
+26.401
0.0%
1 ene 1962 año
26.511
+0.11
0.42%
1 ene 1963 año
28.44
+1.93
7.28%
1 ene 1964 año
33.391
+4.951
17.41%
1 ene 1965 año
34.003
+0.611
1.83%
1 ene 1966 año
27.768
-6.235
-18.34%
1 ene 1967 año
30.405
+2.637
9.5%
1 ene 1968 año
28.73
-1.675
-5.51%
1 ene 1969 año
25.426
-3.304
-11.5%
1 ene 1970 año
24.175
-1.25
-4.92%
1 ene 1971 año
24.408
+0.233
0.96%
1 ene 1972 año
25.104
+0.696
2.85%
1 ene 1973 año
29.01
+3.906
15.56%
1 ene 1974 año
32.116
+3.105
10.7%
1 ene 1975 año
23.805
-8.311
-25.88%
1 ene 1976 año
23.281
-0.524
-2.2%
1 ene 1977 año
22.018
-1.263
-5.42%
1 ene 1978 año
21.271
-0.748
-3.4%
1 ene 1979 año
22.918
+1.647
7.74%
1 ene 1980 año
24.065
+1.147
5.01%
1 ene 1981 año
25.763
+1.698
7.06%
1 ene 1982 año
27.934
+2.17
8.42%
1 ene 1983 año
28.957
+1.023
3.66%
1 ene 1984 año
31.451
+2.494
8.61%
1 ene 1985 año
34.397
+2.946
9.37%
1 ene 1986 año
32.344
-2.054
-5.97%
1 ene 1987 año
40.293
+7.949
24.58%
1 ene 1988 año
26.085
-14.208
-35.26%
1 ene 1989 año
30.538
+4.453
17.07%
1 ene 1990 año
24.693
-5.845
-19.14%
1 ene 1991 año
27.89
+3.197
12.94%
1 ene 1992 año
31.054
+3.164
11.34%
1 ene 1993 año
31.212
+0.158
0.51%
1 ene 1994 año
27.429
-3.783
-12.12%
1 ene 1995 año
27.845
+0.416
1.52%
1 ene 1996 año
30.245
+2.4
8.62%
1 ene 1997 año
32.112
+1.867
6.17%
1 ene 1998 año
29.096
-3.016
-9.39%
1 ene 1999 año
27.047
-2.049
-7.04%
1 ene 2000 año
25.75
-1.297
-4.8%
1 ene 2001 año
31.471
+5.721
22.22%
1 ene 2002 año
32.52
+1.049
3.33%
1 ene 2003 año
27.814
-4.706
-14.47%
1 ene 2004 año
20.425
-7.389
-26.57%
1 ene 2005 año
22.931
+2.506
12.27%
1 ene 2006 año
21.571
-1.36
-5.93%
1 ene 2007 año
20.022
-1.549
-7.18%
1 ene 2008 año
18.786
-1.236
-6.17%
1 ene 2009 año
17.229
-1.556
-8.28%
1 ene 2010 año
19.413
+2.184
12.67%
1 ene 2011 año
23.572
+4.159
21.42%
1 ene 2012 año
26.413
+2.841
12.05%
1 ene 2013 año
31.667
+5.254
19.89%
1 ene 2014 año
36.775
+5.107
16.13%
1 ene 2015 año
39.54
+2.765
7.52%
1 ene 2016 año
46.33
+6.791
17.17%
Ranking de los países por los datos estadísticos actuales


Comentarios: