29
/es/
es
AIzaSyAYiBZKx7MnpbEhh9jyipgxe19OcubqV5w
April 1, 2024
269792
Turkey
TUR
true
2
1
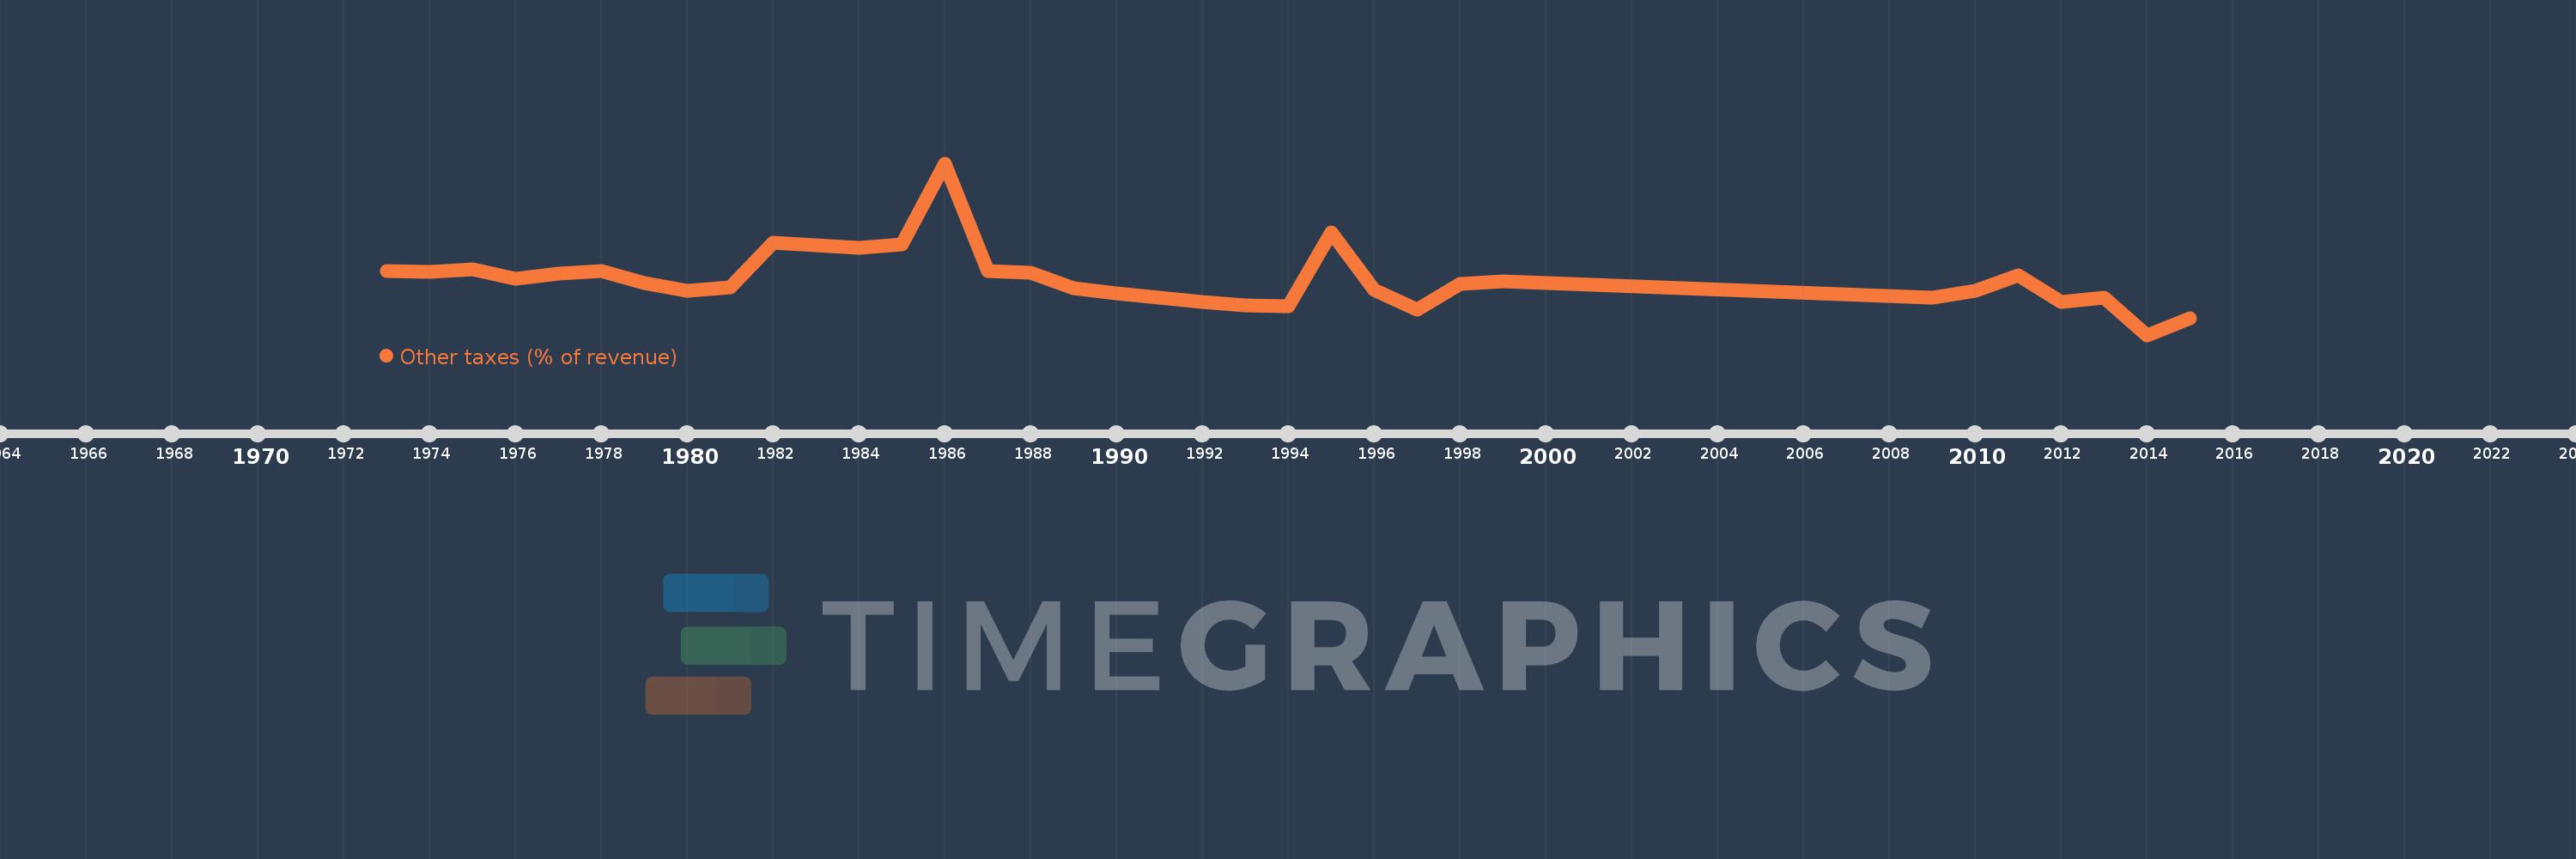
Other taxes (% of revenue)
2015,2014,2013,2012,2011,2010,2009,1999,1998,1997,1996,1995,1994,1993,1992,1991,1990,1989,1988,1987,1986,1985,1984,1982,1981,1980,1979,1978,1977,1976,1975,1974,1973
Estas estadísticas en otros países:
AfghanistanAlbaniaAlgeriaAngolaAntigua and BarbudaArab WorldArgentinaArmeniaAustraliaAustriaAzerbaijanBahamas, TheBahrainBangladeshBarbadosBelarusBelgiumBelizeBeninBhutanBoliviaBosnia and HerzegovinaBotswanaBrazilBulgariaBurkina FasoBurundiCabo VerdeCambodiaCaribbean small statesCentral African RepublicCentral Europe and the BalticsChileChinaColombiaCongo, Dem. Rep.Congo, Rep.Costa RicaCote d'IvoireCroatiaCyprusCzech RepublicDenmarkDominicaDominican RepublicEarly-demographic dividendEast Asia & PacificEast Asia & Pacific (excluding high income)East Asia & Pacific (IDA & IBRD countries)Egypt, Arab Rep.El SalvadorEquatorial GuineaEstoniaEthiopiaEuro areaEurope & Central AsiaEurope & Central Asia (excluding high income)Europe & Central Asia (IDA & IBRD countries)European UnionFijiFinlandFranceGambia, TheGeorgiaGermanyGreeceGrenadaGuatemalaHeavily indebted poor countries (HIPC)High incomeHondurasHong Kong SAR, ChinaHungaryIBRD onlyIcelandIDA & IBRD totalIDA blendIDA onlyIDA totalIndiaIndonesiaIran, Islamic Rep.IraqIrelandIsraelItalyJamaicaJapanJordanKazakhstanKenyaKiribatiKorea, Rep.KuwaitKyrgyz RepublicLao PDRLate-demographic dividendLatin America & Caribbean Latin America & Caribbean (excluding high income)Latin America & the Caribbean (IDA & IBRD countries)LatviaLeast developed countries: UN classificationLebanonLesothoLiberiaLithuaniaLow & middle incomeLow incomeLower middle incomeLuxembourgMacao SAR, ChinaMacedonia, FYRMadagascarMalawiMalaysiaMaldivesMaliMaltaMauritiusMexicoMicronesia, Fed. Sts.Middle East & North AfricaMiddle East & North Africa (excluding high income)Middle East & North Africa (IDA & IBRD countries)Middle incomeMoldovaMongoliaMoroccoMozambiqueNamibiaNepalNetherlandsNew ZealandNicaraguaNorth AmericaNorwayOECD membersOmanOther small statesPakistanPanamaPapua New GuineaParaguayPeruPhilippinesPolandPortugalPost-demographic dividendPre-demographic dividendRomaniaRussian FederationRwandaSamoaSan MarinoSao Tome and PrincipeSenegalSerbiaSeychellesSierra LeoneSingaporeSlovak RepublicSloveniaSmall statesSolomon IslandsSouth AfricaSouth AsiaSouth Asia (IDA & IBRD)SpainSri LankaSt. Kitts and NevisSt. LuciaSub-Saharan Africa Sub-Saharan Africa (excluding high income)Sub-Saharan Africa (IDA & IBRD countries)SurinameSwazilandSwedenSwitzerlandSyrian Arab RepublicTajikistanTanzaniaThailandTimor-LesteTogoTrinidad and TobagoTunisiaTurkeyUgandaUkraineUnited KingdomUnited StatesUpper middle incomeUruguayVanuatuVenezuela, RBVietnamWest Bank and GazaWorldYemen, Rep.ZambiaZimbabwe línea de tiempo (timeline):
En esta escala de tiempo se presenta un gráfico de 1973 y 2015 de Turkey. Los datos de 1972 están ausentes. El número de observaciones reales por fecha: 33.
Fuente (nombre):
Indicadores del desarrollo mundial
Fuente (organización):
International Monetary Fund, Government Finance Statistics Yearbook and data files.
Categorías:
Public Sector
Se ha actualizado:
23 abr 2017 año
Los indicadores de los cambios de valor en los últimos años
Mínimo:
0.957
1 ene 2014 año
Máximo:
9.771
1 ene 1986 año
A la fecha de observación
Valor
Cambio absoluto
El cambio con respecto al valor anterior
1 ene 1973 año
4.219
+4.219
0.0%
1 ene 1974 año
4.216
-0.004
-0.08%
1 ene 1975 año
4.33
+0.114
2.7%
1 ene 1976 año
3.86
-0.469
-10.84%
1 ene 1977 año
4.106
+0.245
6.36%
1 ene 1978 año
4.227
+0.121
2.95%
1 ene 1979 año
3.638
-0.589
-13.94%
1 ene 1980 año
3.241
-0.396
-10.89%
1 ene 1981 año
3.396
+0.154
4.76%
1 ene 1982 año
5.688
+2.292
67.49%
1 ene 1984 año
5.452
-0.236
-4.14%
1 ene 1985 año
5.605
+0.153
2.81%
1 ene 1986 año
9.771
+4.166
74.32%
1 ene 1987 año
4.257
-5.514
-56.43%
1 ene 1988 año
4.146
-0.111
-2.62%
1 ene 1989 año
3.348
-0.797
-19.23%
1 ene 1990 año
3.075
-0.274
-8.18%
1 ene 1991 año
2.888
-0.187
-6.08%
1 ene 1992 año
2.64
-0.248
-8.59%
1 ene 1993 año
2.489
-0.151
-5.71%
1 ene 1994 año
2.452
-0.037
-1.49%
1 ene 1995 año
6.209
+3.757
153.24%
1 ene 1996 año
3.284
-2.926
-47.12%
1 ene 1997 año
2.239
-1.045
-31.83%
1 ene 1998 año
3.583
+1.345
60.08%
1 ene 1999 año
3.708
+0.125
3.49%
1 ene 2009 año
2.873
-0.835
-22.52%
1 ene 2010 año
3.218
+0.344
11.99%
1 ene 2011 año
4.04
+0.823
25.57%
1 ene 2012 año
2.65
-1.39
-34.41%
1 ene 2013 año
2.88
+0.23
8.68%
1 ene 2014 año
0.957
-1.922
-66.75%
1 ene 2015 año
1.811
+0.854
89.18%
Ranking de los países por los datos estadísticos actuales


Comentarios: