29
/es/
es
AIzaSyAYiBZKx7MnpbEhh9jyipgxe19OcubqV5w
April 1, 2024
191771
Malta
MLT
true
2
1
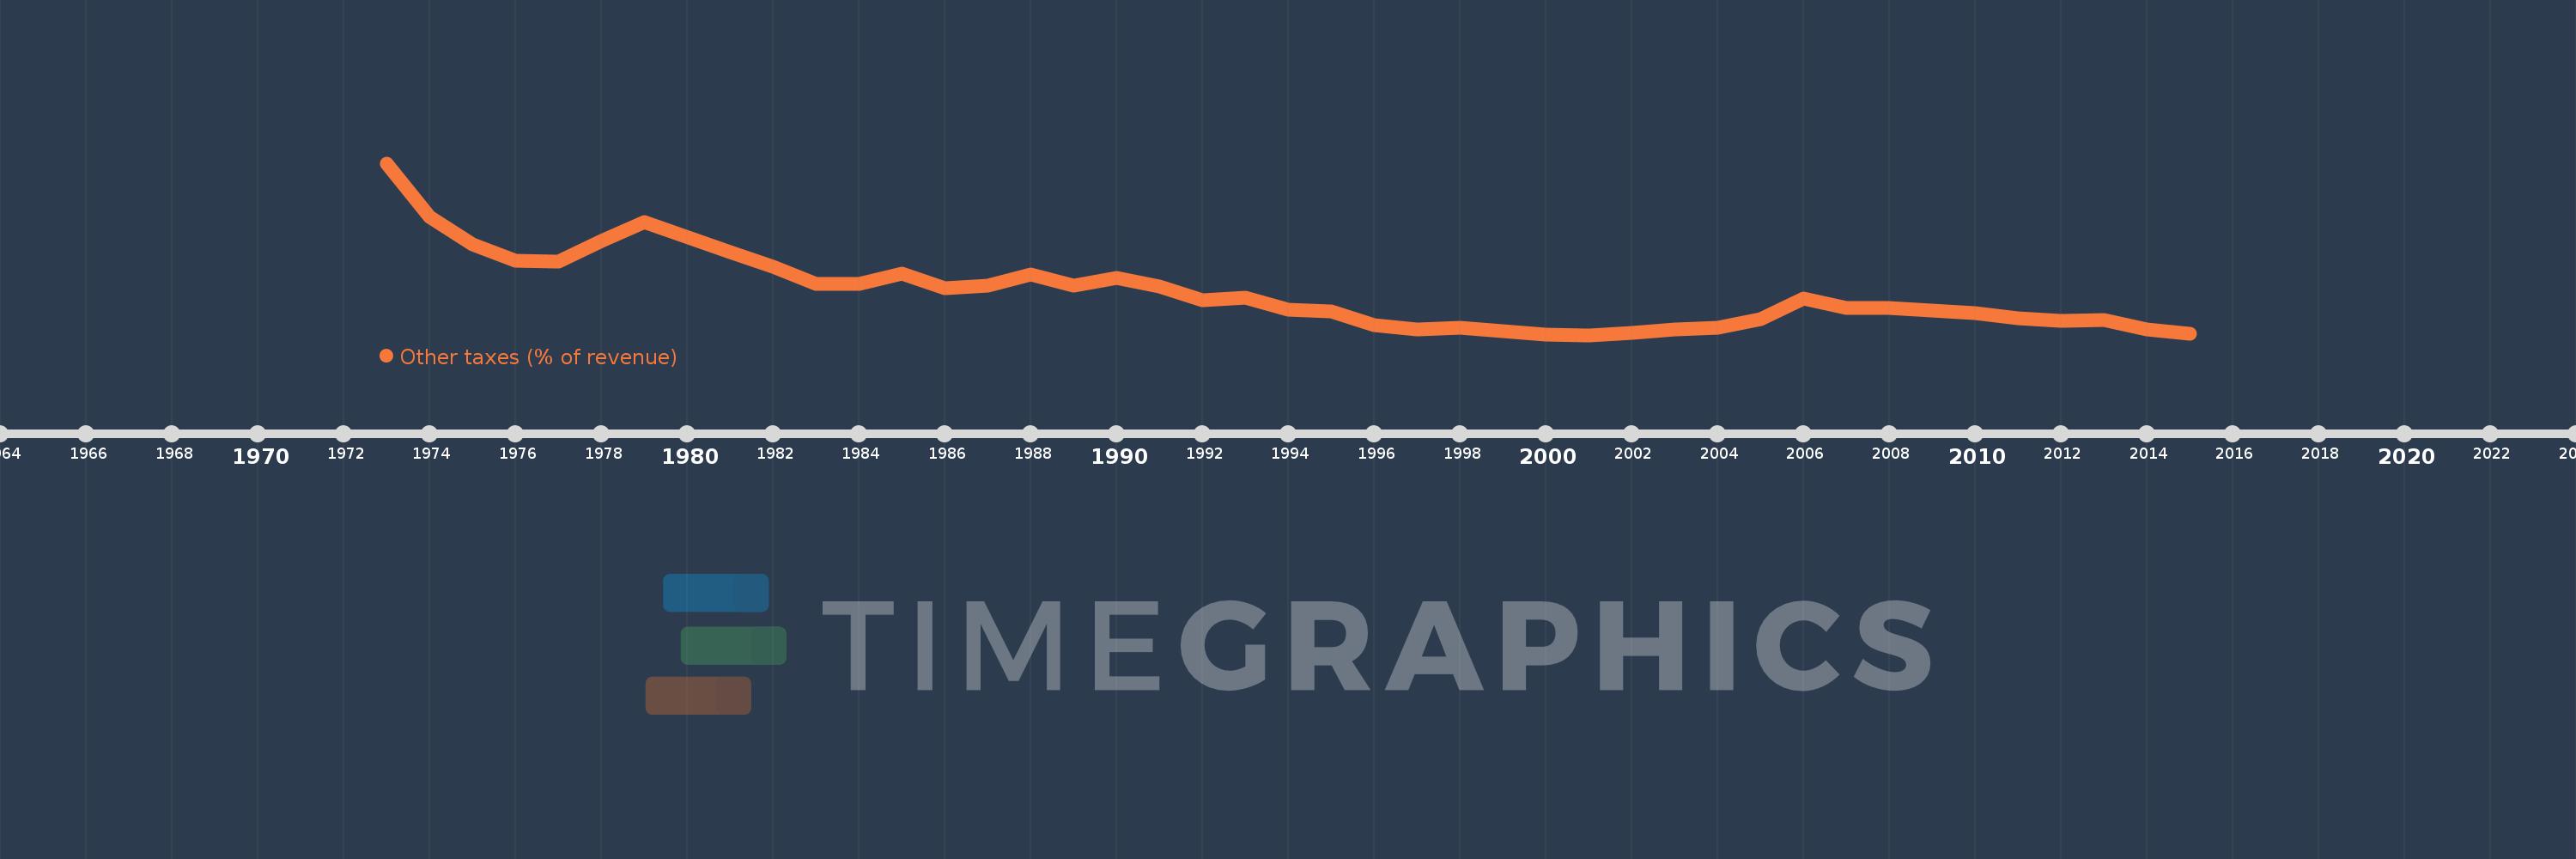
Other taxes (% of revenue)
2015,2014,2013,2012,2011,2010,2009,2008,2007,2006,2005,2004,2003,2002,2001,2000,1999,1998,1997,1996,1995,1994,1993,1992,1991,1990,1989,1988,1987,1986,1985,1984,1983,1982,1981,1979,1978,1977,1976,1975,1974,1973
Estas estadísticas en otros países:
AfghanistanAlbaniaAlgeriaAngolaAntigua and BarbudaArab WorldArgentinaArmeniaAustraliaAustriaAzerbaijanBahamas, TheBahrainBangladeshBarbadosBelarusBelgiumBelizeBeninBhutanBoliviaBosnia and HerzegovinaBotswanaBrazilBulgariaBurkina FasoBurundiCabo VerdeCambodiaCaribbean small statesCentral African RepublicCentral Europe and the BalticsChileChinaColombiaCongo, Dem. Rep.Congo, Rep.Costa RicaCote d'IvoireCroatiaCyprusCzech RepublicDenmarkDominicaDominican RepublicEarly-demographic dividendEast Asia & PacificEast Asia & Pacific (excluding high income)East Asia & Pacific (IDA & IBRD countries)Egypt, Arab Rep.El SalvadorEquatorial GuineaEstoniaEthiopiaEuro areaEurope & Central AsiaEurope & Central Asia (excluding high income)Europe & Central Asia (IDA & IBRD countries)European UnionFijiFinlandFranceGambia, TheGeorgiaGermanyGreeceGrenadaGuatemalaHeavily indebted poor countries (HIPC)High incomeHondurasHong Kong SAR, ChinaHungaryIBRD onlyIcelandIDA & IBRD totalIDA blendIDA onlyIDA totalIndiaIndonesiaIran, Islamic Rep.IraqIrelandIsraelItalyJamaicaJapanJordanKazakhstanKenyaKiribatiKorea, Rep.KuwaitKyrgyz RepublicLao PDRLate-demographic dividendLatin America & Caribbean Latin America & Caribbean (excluding high income)Latin America & the Caribbean (IDA & IBRD countries)LatviaLeast developed countries: UN classificationLebanonLesothoLiberiaLithuaniaLow & middle incomeLow incomeLower middle incomeLuxembourgMacao SAR, ChinaMacedonia, FYRMadagascarMalawiMalaysiaMaldivesMaliMaltaMauritiusMexicoMicronesia, Fed. Sts.Middle East & North AfricaMiddle East & North Africa (excluding high income)Middle East & North Africa (IDA & IBRD countries)Middle incomeMoldovaMongoliaMoroccoMozambiqueNamibiaNepalNetherlandsNew ZealandNicaraguaNorth AmericaNorwayOECD membersOmanOther small statesPakistanPanamaPapua New GuineaParaguayPeruPhilippinesPolandPortugalPost-demographic dividendPre-demographic dividendRomaniaRussian FederationRwandaSamoaSan MarinoSao Tome and PrincipeSenegalSerbiaSeychellesSierra LeoneSingaporeSlovak RepublicSloveniaSmall statesSolomon IslandsSouth AfricaSouth AsiaSouth Asia (IDA & IBRD)SpainSri LankaSt. Kitts and NevisSt. LuciaSub-Saharan Africa Sub-Saharan Africa (excluding high income)Sub-Saharan Africa (IDA & IBRD countries)SurinameSwazilandSwedenSwitzerlandSyrian Arab RepublicTajikistanTanzaniaThailandTimor-LesteTogoTrinidad and TobagoTunisiaTurkeyUgandaUkraineUnited KingdomUnited StatesUpper middle incomeUruguayVanuatuVenezuela, RBVietnamWest Bank and GazaWorldYemen, Rep.ZambiaZimbabwe línea de tiempo (timeline):
En esta escala de tiempo se presenta un gráfico de 1973 y 2015 de Malta. Los datos de 1972 están ausentes. El número de observaciones reales por fecha: 42.
Fuente (nombre):
Indicadores del desarrollo mundial
Fuente (organización):
International Monetary Fund, Government Finance Statistics Yearbook and data files.
Categorías:
Public Sector
Se ha actualizado:
23 abr 2017 año
Los indicadores de los cambios de valor en los últimos años
Mínimo:
0.333
1 ene 2001 año
Máximo:
3.162
1 ene 1973 año
A la fecha de observación
Valor
Cambio absoluto
El cambio con respecto al valor anterior
1 ene 1973 año
3.162
+3.162
0.0%
1 ene 1974 año
2.275
-0.887
-28.06%
1 ene 1975 año
1.829
-0.446
-19.6%
1 ene 1976 año
1.555
-0.273
-14.95%
1 ene 1977 año
1.541
-0.014
-0.93%
1 ene 1978 año
1.878
+0.337
21.87%
1 ene 1979 año
2.192
+0.314
16.71%
1 ene 1981 año
1.701
-0.49
-22.37%
1 ene 1982 año
1.452
-0.25
-14.69%
1 ene 1983 año
1.174
-0.278
-19.13%
1 ene 1984 año
1.18
+0.006
0.52%
1 ene 1985 año
1.347
+0.167
14.17%
1 ene 1986 año
1.107
-0.24
-17.84%
1 ene 1987 año
1.143
+0.036
3.3%
1 ene 1988 año
1.33
+0.187
16.31%
1 ene 1989 año
1.145
-0.185
-13.89%
1 ene 1990 año
1.277
+0.132
11.5%
1 ene 1991 año
1.139
-0.137
-10.76%
1 ene 1992 año
0.909
-0.23
-20.19%
1 ene 1993 año
0.945
+0.036
3.93%
1 ene 1994 año
0.744
-0.201
-21.26%
1 ene 1995 año
0.725
-0.019
-2.61%
1 ene 1996 año
0.495
-0.229
-31.65%
1 ene 1997 año
0.432
-0.064
-12.88%
1 ene 1998 año
0.455
+0.023
5.34%
1 ene 1999 año
0.391
-0.063
-13.91%
1 ene 2000 año
0.34
-0.051
-13.11%
1 ene 2001 año
0.333
-0.007
-1.98%
1 ene 2002 año
0.375
+0.041
12.4%
1 ene 2003 año
0.423
+0.048
12.78%
1 ene 2004 año
0.456
+0.033
7.85%
1 ene 2005 año
0.593
+0.137
30.11%
1 ene 2006 año
0.941
+0.348
58.67%
1 ene 2007 año
0.773
-0.168
-17.87%
1 ene 2008 año
0.785
+0.013
1.62%
1 ene 2009 año
0.731
-0.054
-6.92%
1 ene 2010 año
0.689
-0.042
-5.79%
1 ene 2011 año
0.602
-0.087
-12.65%
1 ene 2012 año
0.564
-0.037
-6.21%
1 ene 2013 año
0.579
+0.015
2.61%
1 ene 2014 año
0.428
-0.151
-26.1%
1 ene 2015 año
0.359
-0.069
-16.13%
Ranking de los países por los datos estadísticos actuales


Comentarios: