29
/es/
es
AIzaSyAYiBZKx7MnpbEhh9jyipgxe19OcubqV5w
April 1, 2024
266379
Tonga
TON
true
2
1
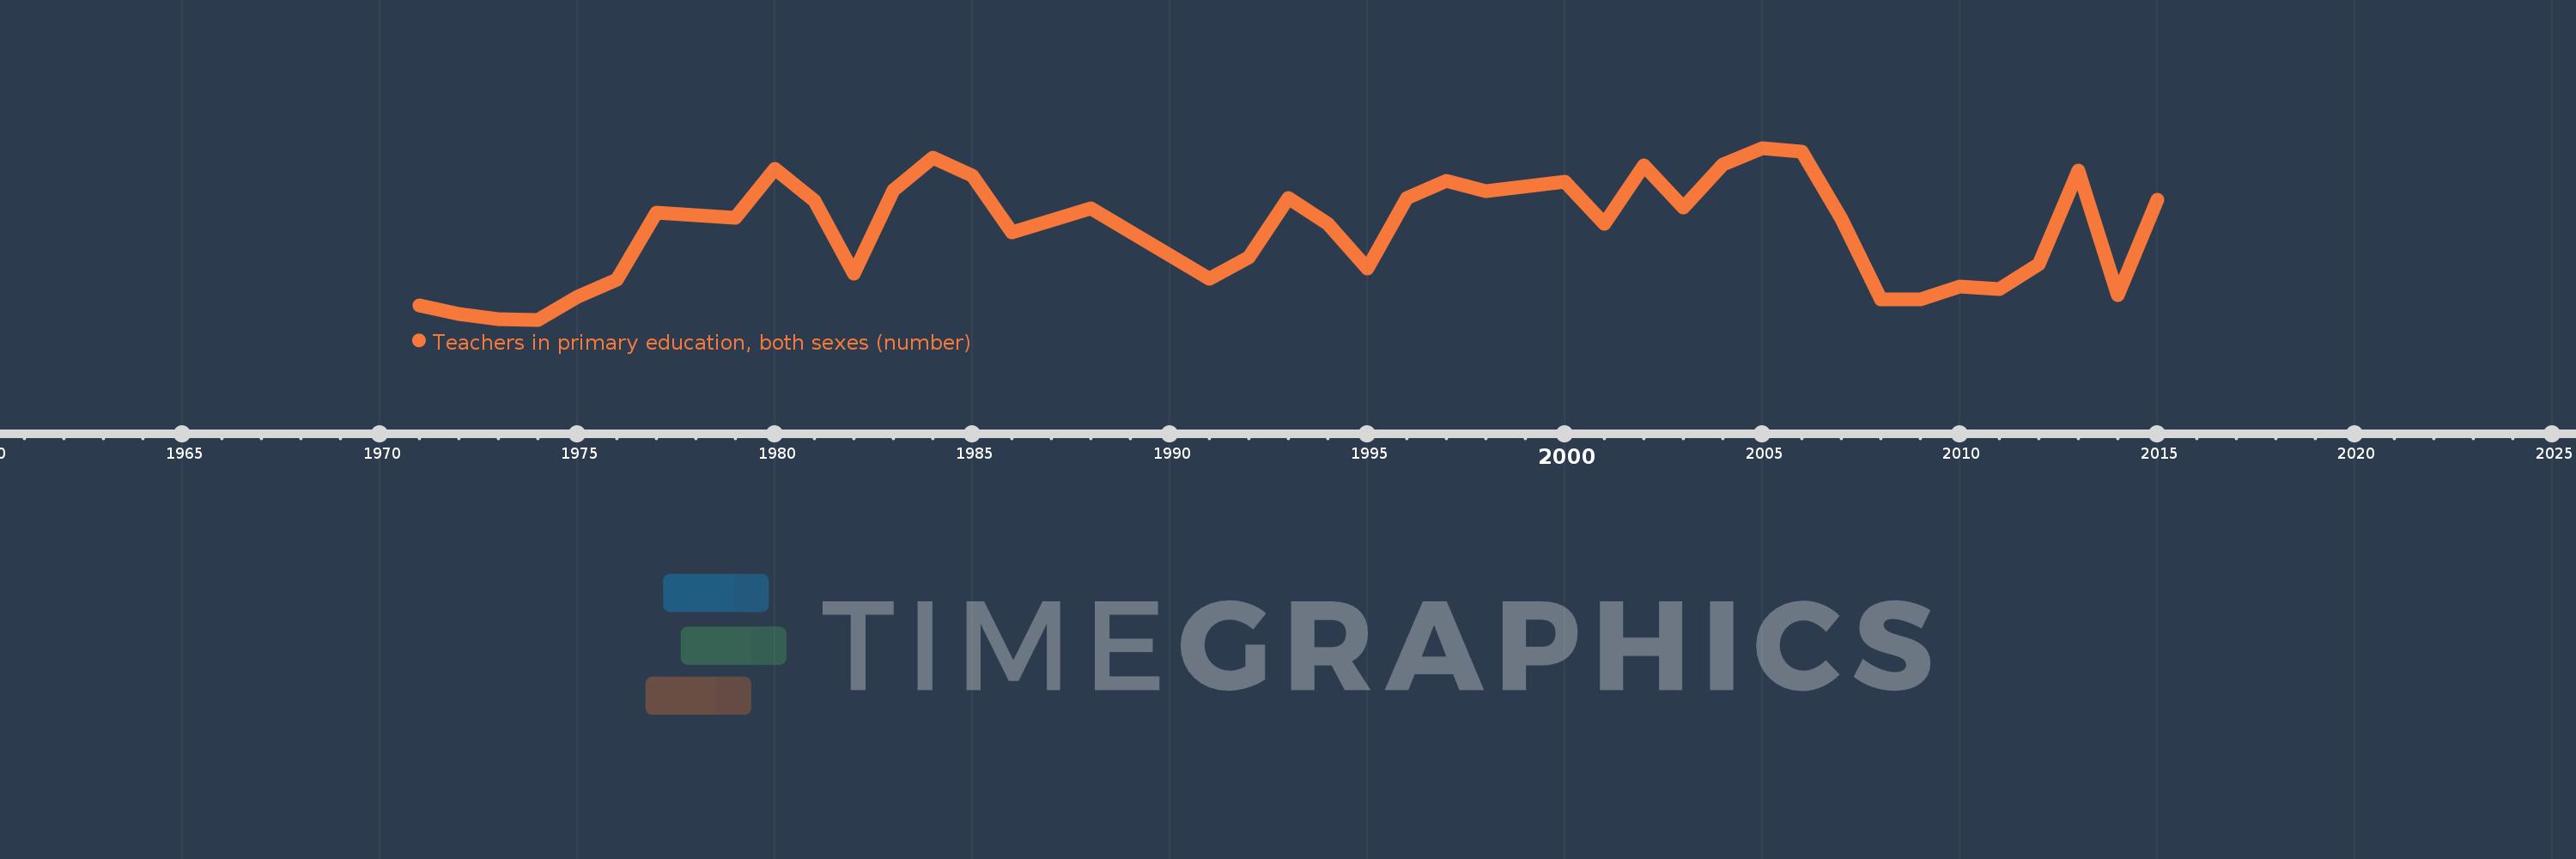
Teachers in primary education, both sexes (number)
2015,2014,2013,2012,2011,2010,2009,2008,2007,2006,2005,2004,2003,2002,2001,2000,1998,1997,1996,1995,1994,1993,1992,1991,1988,1987,1986,1985,1984,1983,1982,1981,1980,1979,1977,1976,1975,1974,1973,1972,1971
Estas estadísticas en otros países:
AfghanistanAlbaniaAlgeriaAmerican SamoaAndorraAngolaAntigua and BarbudaArab WorldArgentinaArmeniaArubaAustraliaAustriaAzerbaijanBahamas, TheBahrainBangladeshBarbadosBelarusBelgiumBelizeBeninBermudaBhutanBoliviaBosnia and HerzegovinaBotswanaBrazilBritish Virgin IslandsBrunei DarussalamBulgariaBurkina FasoBurundiCabo VerdeCambodiaCameroonCanadaCaribbean small statesCayman IslandsCentral African RepublicCentral Europe and the BalticsChadChileChinaColombiaComorosCongo, Dem. Rep.Congo, Rep.Costa RicaCote d'IvoireCroatiaCubaCyprusCzech RepublicDenmarkDjiboutiDominicaDominican RepublicEarly-demographic dividendEast Asia & PacificEast Asia & Pacific (excluding high income)East Asia & Pacific (IDA & IBRD countries)EcuadorEgypt, Arab Rep.El SalvadorEquatorial GuineaEritreaEstoniaEthiopiaEuro areaEurope & Central AsiaEurope & Central Asia (excluding high income)Europe & Central Asia (IDA & IBRD countries)European UnionFijiFinlandFragile and conflict affected situationsFranceFrench PolynesiaGabonGambia, TheGeorgiaGermanyGhanaGibraltarGreeceGrenadaGuamGuatemalaGuineaGuinea-BissauGuyanaHaitiHeavily indebted poor countries (HIPC)High incomeHondurasHong Kong SAR, ChinaHungaryIBRD onlyIcelandIDA & IBRD totalIDA blendIDA onlyIDA totalIndiaIndonesiaIran, Islamic Rep.IraqIrelandIsraelItalyJamaicaJapanJordanKazakhstanKenyaKiribatiKorea, Dem. People’s Rep.Korea, Rep.KuwaitKyrgyz RepublicLao PDRLate-demographic dividendLatin America & Caribbean Latin America & Caribbean (excluding high income)Latin America & the Caribbean (IDA & IBRD countries)LatviaLeast developed countries: UN classificationLebanonLesothoLiberiaLibyaLiechtensteinLithuaniaLow & middle incomeLow incomeLower middle incomeLuxembourgMacao SAR, ChinaMacedonia, FYRMadagascarMalawiMalaysiaMaldivesMaliMaltaMarshall IslandsMauritaniaMauritiusMexicoMicronesia, Fed. Sts.Middle East & North AfricaMiddle East & North Africa (excluding high income)Middle East & North Africa (IDA & IBRD countries)Middle incomeMoldovaMonacoMongoliaMoroccoMozambiqueMyanmarNamibiaNauruNepalNetherlandsNew CaledoniaNew ZealandNicaraguaNigerNigeriaNorth AmericaNorwayOECD membersOmanOther small statesPacific island small statesPakistanPalauPanamaPapua New GuineaParaguayPeruPhilippinesPolandPortugalPost-demographic dividendPre-demographic dividendPuerto RicoQatarRomaniaRussian FederationRwandaSamoaSan MarinoSao Tome and PrincipeSaudi ArabiaSenegalSerbiaSeychellesSierra LeoneSingaporeSint Maarten (Dutch part)Slovak RepublicSloveniaSmall statesSolomon IslandsSomaliaSouth AfricaSouth AsiaSouth Asia (IDA & IBRD)South SudanSpainSri LankaSt. Kitts and NevisSt. LuciaSt. Vincent and the GrenadinesSub-Saharan Africa Sub-Saharan Africa (excluding high income)Sub-Saharan Africa (IDA & IBRD countries)SudanSurinameSwazilandSwedenSwitzerlandSyrian Arab RepublicTajikistanTanzaniaThailandTimor-LesteTogoTongaTrinidad and TobagoTunisiaTurkeyTurks and Caicos IslandsTuvaluUgandaUkraineUnited Arab EmiratesUnited KingdomUnited StatesUpper middle incomeUruguayUzbekistanVanuatuVenezuela, RBVietnamVirgin Islands (U.S.)West Bank and GazaWorldYemen, Rep.ZambiaZimbabwe línea de tiempo (timeline):
En esta escala de tiempo se presenta un gráfico de 1971 y 2015 de Tonga. Los datos de 1970 están ausentes. El número de observaciones reales por fecha: 41.
Fuente (nombre):
Indicadores del desarrollo mundial
Fuente (organización):
UNESCO Institute for Statistics
Categorías:
Education
Se ha actualizado:
23 abr 2017 año
Los indicadores de los cambios de valor en los últimos años
Mínimo:
641.0
1 ene 1974 año
Máximo:
843.0
1 ene 2005 año
A la fecha de observación
Valor
Cambio absoluto
El cambio con respecto al valor anterior
1 ene 1971 año
658.0
+658.0
0.0%
1 ene 1972 año
648.0
-10.0
-1.52%
1 ene 1973 año
642.0
-6.0
-0.93%
1 ene 1974 año
641.0
-1.0
-0.16%
1 ene 1975 año
668.0
+27.0
4.21%
1 ene 1976 año
688.0
+20.0
2.99%
1 ene 1977 año
767.0
+79.0
11.48%
1 ene 1979 año
761.0
-6.0
-0.78%
1 ene 1980 año
818.0
+57.0
7.49%
1 ene 1981 año
781.0
-37.0
-4.52%
1 ene 1982 año
695.0
-86.0
-11.01%
1 ene 1983 año
793.0
+98.0
14.1%
1 ene 1984 año
832.0
+39.0
4.92%
1 ene 1985 año
810.0
-22.0
-2.64%
1 ene 1986 año
744.0
-66.0
-8.15%
1 ene 1987 año
758.0
+14.0
1.88%
1 ene 1988 año
772.0
+14.0
1.85%
1 ene 1991 año
689.0
-83.0
-10.75%
1 ene 1992 año
714.0
+25.0
3.63%
1 ene 1993 año
784.0
+70.0
9.8%
1 ene 1994 año
754.0
-30.0
-3.83%
1 ene 1995 año
701.0
-53.0
-7.03%
1 ene 1996 año
784.0
+83.0
11.84%
1 ene 1997 año
804.0
+20.0
2.55%
1 ene 1998 año
792.0
-12.0
-1.49%
1 ene 2000 año
803.0
+11.0
1.39%
1 ene 2001 año
754.0
-49.0
-6.1%
1 ene 2002 año
823.0
+69.0
9.15%
1 ene 2003 año
773.0
-50.0
-6.08%
1 ene 2004 año
824.0
+51.0
6.6%
1 ene 2005 año
843.0
+19.0
2.31%
1 ene 2006 año
839.0
-4.0
-0.47%
1 ene 2007 año
760.0
-79.0
-9.42%
1 ene 2008 año
665.0
-95.0
-12.5%
1 ene 2009 año
665.0
0.0
0.0%
1 ene 2010 año
680.0
+15.0
2.26%
1 ene 2011 año
677.0
-3.0
-0.44%
1 ene 2012 año
706.0
+29.0
4.28%
1 ene 2013 año
816.0
+110.0
15.58%
1 ene 2014 año
670.0
-146.0
-17.89%
1 ene 2015 año
782.0
+112.0
16.72%
Ranking de los países por los datos estadísticos actuales


Comentarios: