29
/es/
es
AIzaSyAYiBZKx7MnpbEhh9jyipgxe19OcubqV5w
April 1, 2024
120518
Djibouti
DJI
true
2
1
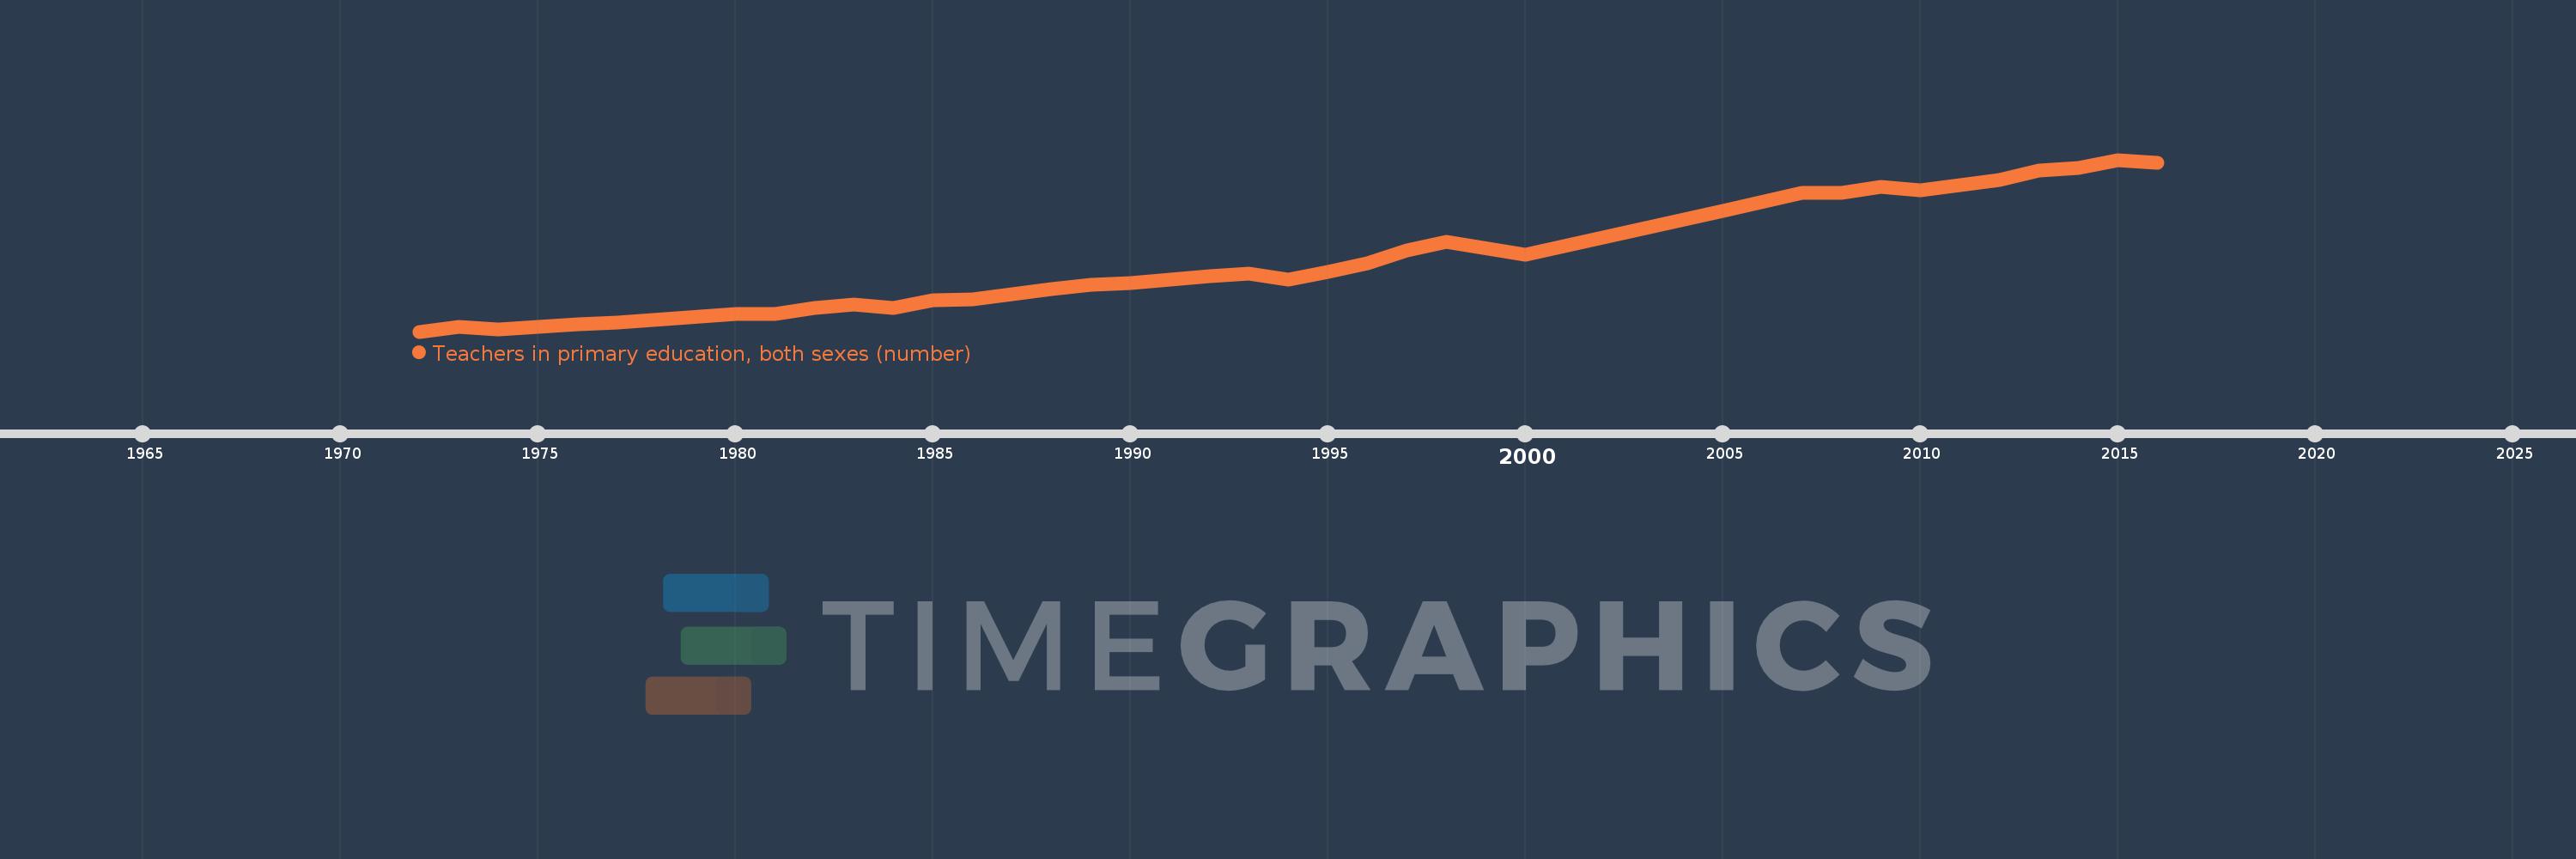
Teachers in primary education, both sexes (number)
2016,2015,2014,2013,2012,2010,2009,2008,2007,2005,2000,1998,1997,1996,1995,1994,1993,1992,1991,1990,1989,1988,1986,1985,1984,1983,1982,1981,1980,1977,1976,1975,1974,1973,1972
Estas estadísticas en otros países:
AfghanistanAlbaniaAlgeriaAmerican SamoaAndorraAngolaAntigua and BarbudaArab WorldArgentinaArmeniaArubaAustraliaAustriaAzerbaijanBahamas, TheBahrainBangladeshBarbadosBelarusBelgiumBelizeBeninBermudaBhutanBoliviaBosnia and HerzegovinaBotswanaBrazilBritish Virgin IslandsBrunei DarussalamBulgariaBurkina FasoBurundiCabo VerdeCambodiaCameroonCanadaCaribbean small statesCayman IslandsCentral African RepublicCentral Europe and the BalticsChadChileChinaColombiaComorosCongo, Dem. Rep.Congo, Rep.Costa RicaCote d'IvoireCroatiaCubaCyprusCzech RepublicDenmarkDjiboutiDominicaDominican RepublicEarly-demographic dividendEast Asia & PacificEast Asia & Pacific (excluding high income)East Asia & Pacific (IDA & IBRD countries)EcuadorEgypt, Arab Rep.El SalvadorEquatorial GuineaEritreaEstoniaEthiopiaEuro areaEurope & Central AsiaEurope & Central Asia (excluding high income)Europe & Central Asia (IDA & IBRD countries)European UnionFijiFinlandFragile and conflict affected situationsFranceFrench PolynesiaGabonGambia, TheGeorgiaGermanyGhanaGibraltarGreeceGrenadaGuamGuatemalaGuineaGuinea-BissauGuyanaHaitiHeavily indebted poor countries (HIPC)High incomeHondurasHong Kong SAR, ChinaHungaryIBRD onlyIcelandIDA & IBRD totalIDA blendIDA onlyIDA totalIndiaIndonesiaIran, Islamic Rep.IraqIrelandIsraelItalyJamaicaJapanJordanKazakhstanKenyaKiribatiKorea, Dem. People’s Rep.Korea, Rep.KuwaitKyrgyz RepublicLao PDRLate-demographic dividendLatin America & Caribbean Latin America & Caribbean (excluding high income)Latin America & the Caribbean (IDA & IBRD countries)LatviaLeast developed countries: UN classificationLebanonLesothoLiberiaLibyaLiechtensteinLithuaniaLow & middle incomeLow incomeLower middle incomeLuxembourgMacao SAR, ChinaMacedonia, FYRMadagascarMalawiMalaysiaMaldivesMaliMaltaMarshall IslandsMauritaniaMauritiusMexicoMicronesia, Fed. Sts.Middle East & North AfricaMiddle East & North Africa (excluding high income)Middle East & North Africa (IDA & IBRD countries)Middle incomeMoldovaMonacoMongoliaMoroccoMozambiqueMyanmarNamibiaNauruNepalNetherlandsNew CaledoniaNew ZealandNicaraguaNigerNigeriaNorth AmericaNorwayOECD membersOmanOther small statesPacific island small statesPakistanPalauPanamaPapua New GuineaParaguayPeruPhilippinesPolandPortugalPost-demographic dividendPre-demographic dividendPuerto RicoQatarRomaniaRussian FederationRwandaSamoaSan MarinoSao Tome and PrincipeSaudi ArabiaSenegalSerbiaSeychellesSierra LeoneSingaporeSint Maarten (Dutch part)Slovak RepublicSloveniaSmall statesSolomon IslandsSomaliaSouth AfricaSouth AsiaSouth Asia (IDA & IBRD)South SudanSpainSri LankaSt. Kitts and NevisSt. LuciaSt. Vincent and the GrenadinesSub-Saharan Africa Sub-Saharan Africa (excluding high income)Sub-Saharan Africa (IDA & IBRD countries)SudanSurinameSwazilandSwedenSwitzerlandSyrian Arab RepublicTajikistanTanzaniaThailandTimor-LesteTogoTongaTrinidad and TobagoTunisiaTurkeyTurks and Caicos IslandsTuvaluUgandaUkraineUnited Arab EmiratesUnited KingdomUnited StatesUpper middle incomeUruguayUzbekistanVanuatuVenezuela, RBVietnamVirgin Islands (U.S.)West Bank and GazaWorldYemen, Rep.ZambiaZimbabwe línea de tiempo (timeline):
En esta escala de tiempo se presenta un gráfico de 1972 y 2016 de Djibouti. Los datos de 1971 están ausentes. El número de observaciones reales por fecha: 35.
Fuente (nombre):
Indicadores del desarrollo mundial
Fuente (organización):
UNESCO Institute for Statistics
Categorías:
Education
Se ha actualizado:
23 abr 2017 año
Los indicadores de los cambios de valor en los últimos años
Mínimo:
180.0
1 ene 1972 año
Máximo:
1.935 mil
1 ene 2015 año
A la fecha de observación
Valor
Cambio absoluto
El cambio con respecto al valor anterior
1 ene 1972 año
180.0
+180.0
0.0%
1 ene 1973 año
228.0
+48.0
26.67%
1 ene 1974 año
206.0
-22.0
-9.65%
1 ene 1975 año
229.0
+23.0
11.17%
1 ene 1976 año
251.0
+22.0
9.61%
1 ene 1977 año
268.0
+17.0
6.77%
1 ene 1980 año
358.0
+90.0
33.58%
1 ene 1981 año
360.0
+2.0
0.56%
1 ene 1982 año
419.0
+59.0
16.39%
1 ene 1983 año
460.0
+41.0
9.79%
1 ene 1984 año
423.0
-37.0
-8.04%
1 ene 1985 año
496.0
+73.0
17.26%
1 ene 1986 año
511.0
+15.0
3.02%
1 ene 1988 año
617.0
+106.0
20.74%
1 ene 1989 año
655.0
+38.0
6.16%
1 ene 1990 año
680.0
+25.0
3.82%
1 ene 1991 año
711.0
+31.0
4.56%
1 ene 1992 año
742.0
+31.0
4.36%
1 ene 1993 año
769.0
+27.0
3.64%
1 ene 1994 año
714.0
-55.0
-7.15%
1 ene 1995 año
787.0
+73.0
10.22%
1 ene 1996 año
881.0
+94.0
11.94%
1 ene 1997 año
1.005 mil
+124.0
14.07%
1 ene 1998 año
1.096 mil
+91.0
9.05%
1 ene 2000 año
966.0
-130.0
-11.86%
1 ene 2005 año
1.41 mil
+444.0
45.96%
1 ene 2007 año
1.598 mil
+188.0
13.33%
1 ene 2008 año
1.597 mil
-1.0
-0.06%
1 ene 2009 año
1.657 mil
+60.0
3.76%
1 ene 2010 año
1.627 mil
-30.0
-1.81%
1 ene 2012 año
1.731 mil
+104.0
6.39%
1 ene 2013 año
1.821 mil
+90.0
5.2%
1 ene 2014 año
1.852 mil
+31.0
1.7%
1 ene 2015 año
1.935 mil
+83.0
4.48%
1 ene 2016 año
1.906 mil
-29.0
-1.5%
Ranking de los países por los datos estadísticos actuales


Comentarios: