29
/es/
es
AIzaSyAYiBZKx7MnpbEhh9jyipgxe19OcubqV5w
April 1, 2024
265313
Togo
TGO
true
2
1
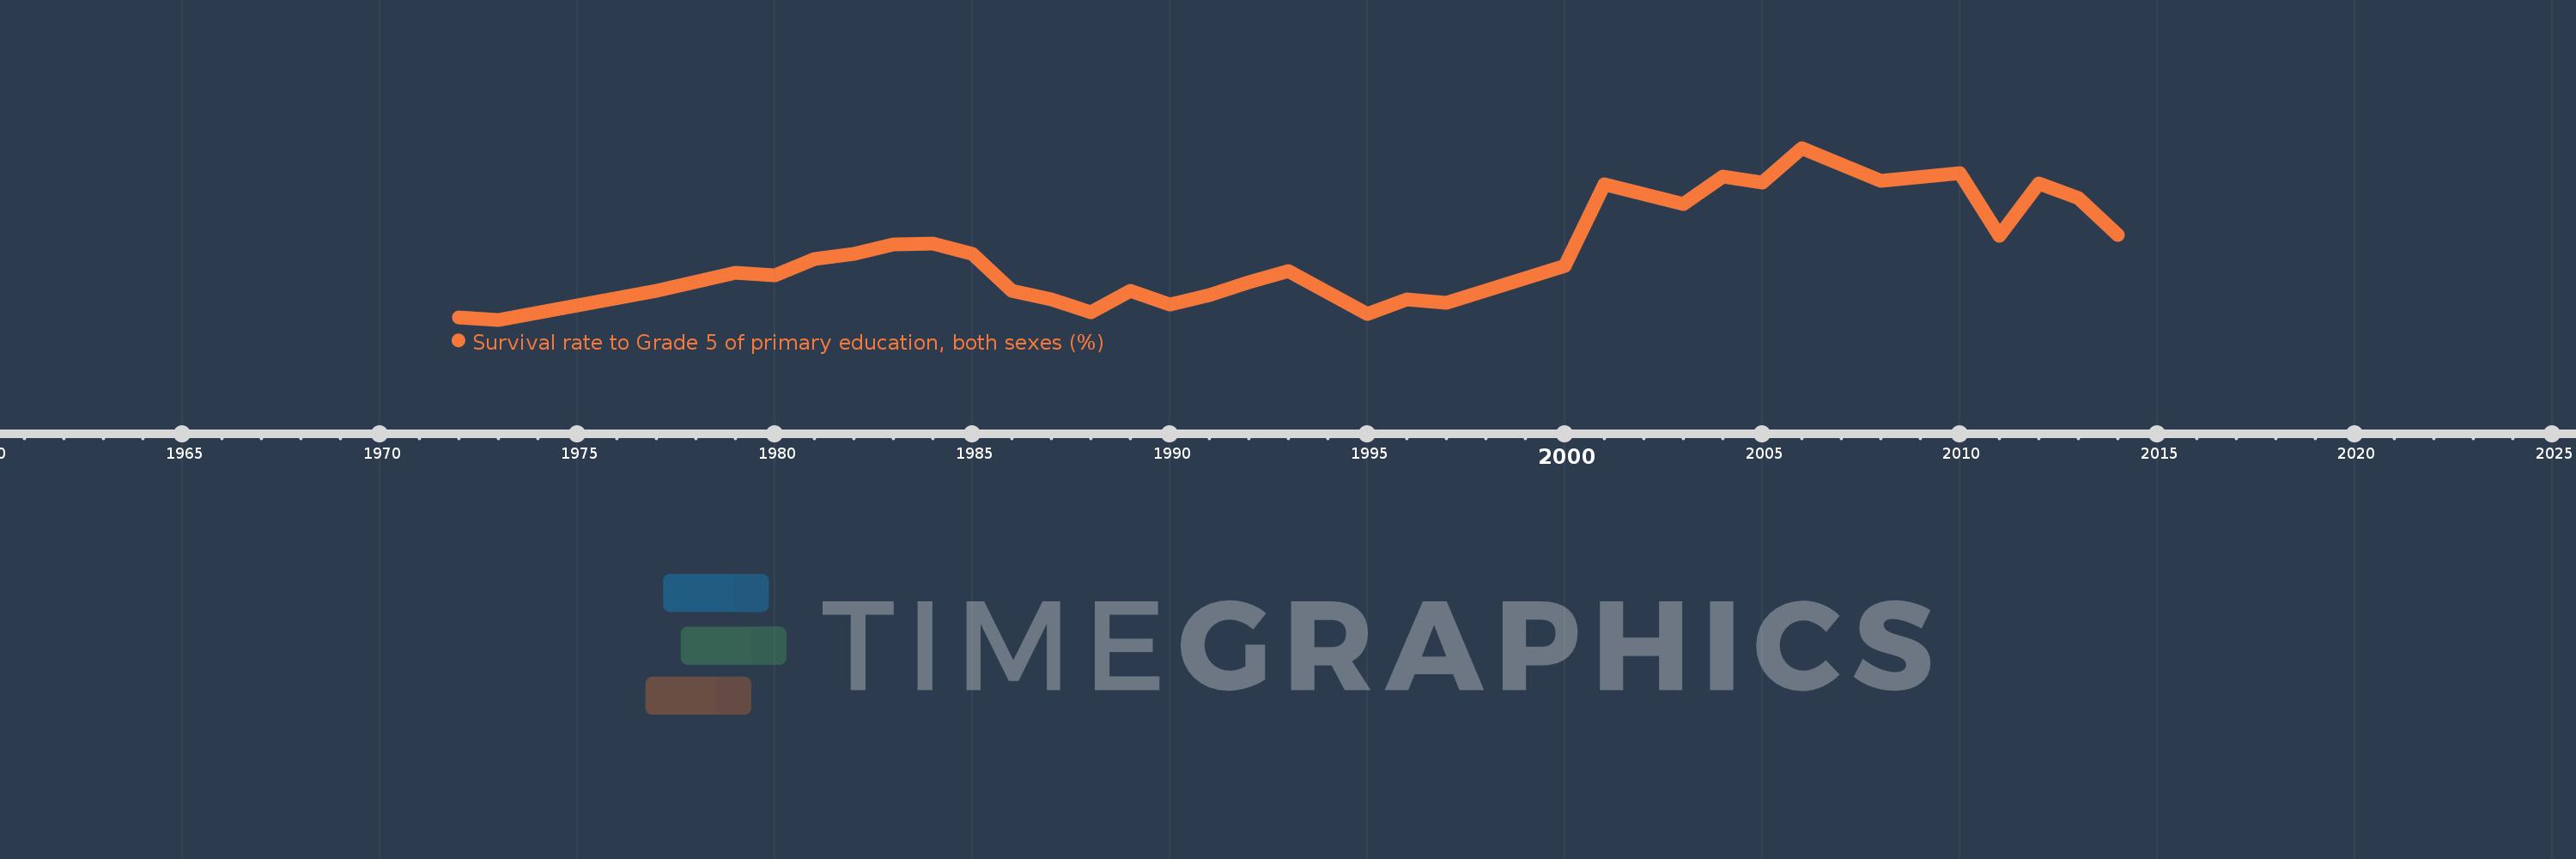
Survival rate to Grade 5 of primary education, both sexes (%)
2014,2013,2012,2011,2010,2008,2006,2005,2004,2003,2001,2000,1997,1996,1995,1993,1992,1991,1990,1989,1988,1987,1986,1985,1984,1983,1982,1981,1980,1979,1977,1973,1972
Estas estadísticas en otros países:
AfghanistanAlbaniaAlgeriaAndorraAngolaAntigua and BarbudaArab WorldArgentinaArubaBahamas, TheBahrainBangladeshBarbadosBelarusBelgiumBelizeBeninBermudaBhutanBoliviaBosnia and HerzegovinaBotswanaBritish Virgin IslandsBrunei DarussalamBurkina FasoBurundiCabo VerdeCambodiaCameroonCanadaCaribbean small statesCayman IslandsCentral African RepublicChadChileChinaColombiaComorosCongo, Dem. Rep.Congo, Rep.Costa RicaCote d'IvoireCubaCyprusCzech RepublicDenmarkDjiboutiDominicaDominican RepublicEarly-demographic dividendEast Asia & PacificEast Asia & Pacific (excluding high income)East Asia & Pacific (IDA & IBRD countries)EcuadorEgypt, Arab Rep.El SalvadorEquatorial GuineaEritreaEstoniaEthiopiaFijiFinlandFranceGabonGambia, TheGeorgiaGhanaGreeceGrenadaGuatemalaGuineaGuinea-BissauGuyanaHaitiHeavily indebted poor countries (HIPC)HondurasHong Kong SAR, ChinaHungaryIBRD onlyIcelandIDA blendIDA onlyIDA totalIndiaIndonesiaIran, Islamic Rep.IraqIrelandIsraelItalyJamaicaJapanJordanKenyaKiribatiKorea, Rep.KuwaitLao PDRLate-demographic dividendLatviaLeast developed countries: UN classificationLebanonLesothoLiberiaLibyaLiechtensteinLow incomeLower middle incomeLuxembourgMacao SAR, ChinaMadagascarMalawiMalaysiaMaldivesMaliMaltaMarshall IslandsMauritaniaMauritiusMexicoMiddle East & North AfricaMiddle East & North Africa (excluding high income)Middle East & North Africa (IDA & IBRD countries)MonacoMontenegroMoroccoMozambiqueMyanmarNamibiaNepalNetherlandsNicaraguaNigerNigeriaNorwayOmanOther small statesPacific island small statesPakistanPanamaPapua New GuineaParaguayPeruPhilippinesPolandPortugalPre-demographic dividendQatarRwandaSamoaSan MarinoSao Tome and PrincipeSaudi ArabiaSenegalSeychellesSierra LeoneSingaporeSloveniaSolomon IslandsSouth AfricaSouth AsiaSouth Asia (IDA & IBRD)SpainSri LankaSt. Kitts and NevisSt. LuciaSt. Vincent and the GrenadinesSub-Saharan Africa Sub-Saharan Africa (excluding high income)Sub-Saharan Africa (IDA & IBRD countries)SudanSurinameSwazilandSwedenSwitzerlandSyrian Arab RepublicTanzaniaThailandTimor-LesteTogoTongaTrinidad and TobagoTunisiaTurkeyTuvaluUgandaUnited Arab EmiratesUpper middle incomeUruguayVanuatuVenezuela, RBVietnamYemen, Rep.ZambiaZimbabwe línea de tiempo (timeline):
En esta escala de tiempo se presenta un gráfico de 1972 y 2014 de Togo. Los datos de 1971 están ausentes. El número de observaciones reales por fecha: 33.
Fuente (nombre):
Indicadores del desarrollo mundial
Fuente (organización):
UNESCO Institute for Statistics
Categorías:
Education
Se ha actualizado:
23 abr 2017 año
Los indicadores de los cambios de valor en los últimos años
Mínimo:
37.737
1 ene 1973 año
Máximo:
84.652
1 ene 2006 año
A la fecha de observación
Valor
Cambio absoluto
El cambio con respecto al valor anterior
1 ene 1972 año
38.414
+38.414
0.0%
1 ene 1973 año
37.737
-0.677
-1.76%
1 ene 1977 año
45.728
+7.991
21.18%
1 ene 1979 año
50.662
+4.934
10.79%
1 ene 1980 año
49.938
-0.725
-1.43%
1 ene 1981 año
54.296
+4.359
8.73%
1 ene 1982 año
55.751
+1.455
2.68%
1 ene 1983 año
58.278
+2.527
4.53%
1 ene 1984 año
58.493
+0.215
0.37%
1 ene 1985 año
55.798
-2.695
-4.61%
1 ene 1986 año
45.72
-10.078
-18.06%
1 ene 1987 año
43.251
-2.469
-5.4%
1 ene 1988 año
39.793
-3.458
-8.0%
1 ene 1989 año
45.668
+5.876
14.77%
1 ene 1990 año
41.822
-3.846
-8.42%
1 ene 1991 año
44.52
+2.698
6.45%
1 ene 1992 año
47.934
+3.414
7.67%
1 ene 1993 año
50.991
+3.056
6.38%
1 ene 1995 año
39.202
-11.788
-23.12%
1 ene 1996 año
43.396
+4.194
10.7%
1 ene 1997 año
42.286
-1.11
-2.56%
1 ene 2000 año
52.482
+10.196
24.11%
1 ene 2001 año
74.74
+22.258
42.41%
1 ene 2003 año
69.265
-5.475
-7.33%
1 ene 2004 año
76.774
+7.509
10.84%
1 ene 2005 año
75.247
-1.527
-1.99%
1 ene 2006 año
84.652
+9.404
12.5%
1 ene 2008 año
75.714
-8.938
-10.56%
1 ene 2010 año
77.669
+1.955
2.58%
1 ene 2011 año
60.751
-16.919
-21.78%
1 ene 2012 año
74.916
+14.165
23.32%
1 ene 2013 año
70.865
-4.051
-5.41%
1 ene 2014 año
60.795
-10.07
-14.21%
Ranking de los países por los datos estadísticos actuales


Comentarios: