29
/es/
es
AIzaSyAYiBZKx7MnpbEhh9jyipgxe19OcubqV5w
April 1, 2024
124242
Ecuador
ECU
true
2
1
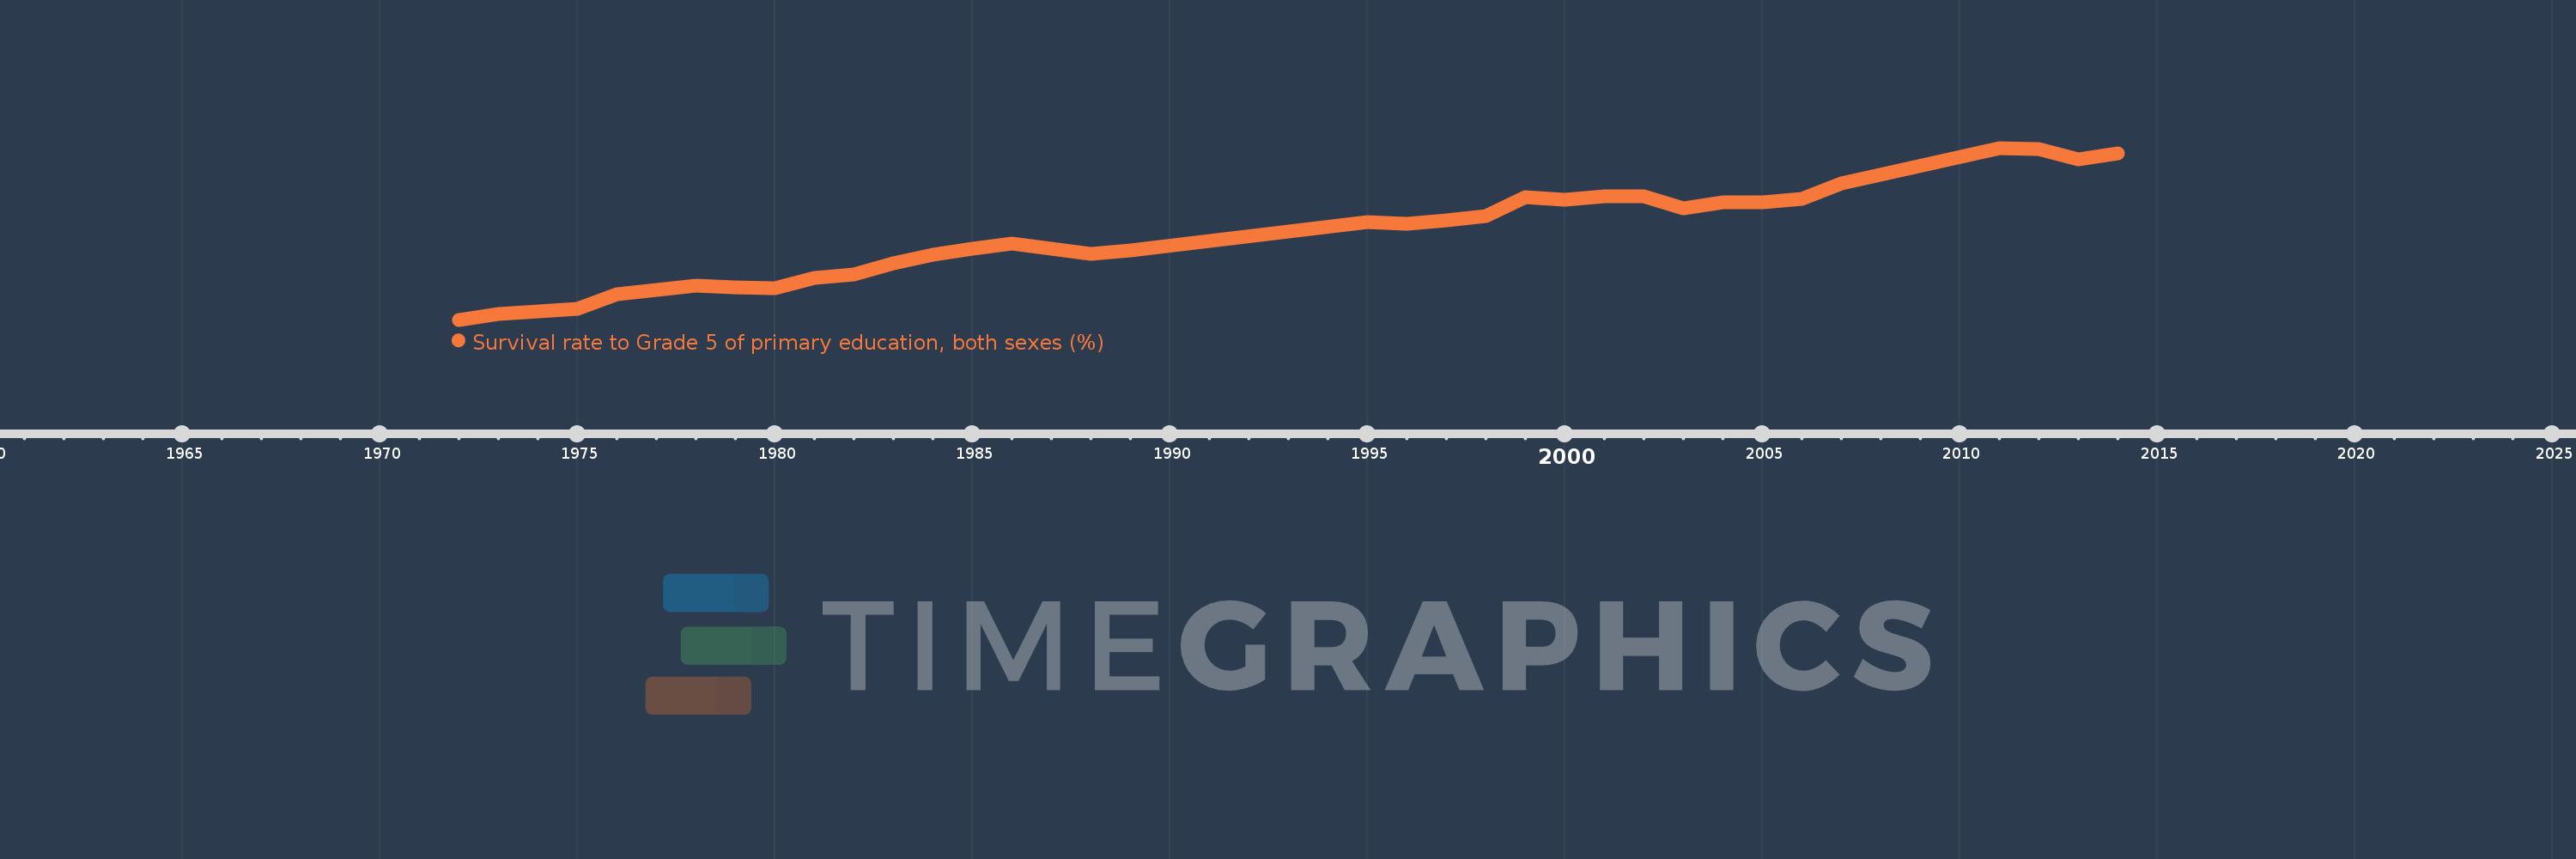
Survival rate to Grade 5 of primary education, both sexes (%)
2014,2013,2012,2011,2007,2006,2005,2004,2003,2002,2001,2000,1999,1998,1997,1996,1995,1989,1988,1986,1985,1984,1983,1982,1981,1980,1979,1978,1977,1976,1975,1974,1973,1972
Estas estadísticas en otros países:
AfghanistanAlbaniaAlgeriaAndorraAngolaAntigua and BarbudaArab WorldArgentinaArubaBahamas, TheBahrainBangladeshBarbadosBelarusBelgiumBelizeBeninBermudaBhutanBoliviaBosnia and HerzegovinaBotswanaBritish Virgin IslandsBrunei DarussalamBurkina FasoBurundiCabo VerdeCambodiaCameroonCanadaCaribbean small statesCayman IslandsCentral African RepublicChadChileChinaColombiaComorosCongo, Dem. Rep.Congo, Rep.Costa RicaCote d'IvoireCubaCyprusCzech RepublicDenmarkDjiboutiDominicaDominican RepublicEarly-demographic dividendEast Asia & PacificEast Asia & Pacific (excluding high income)East Asia & Pacific (IDA & IBRD countries)EcuadorEgypt, Arab Rep.El SalvadorEquatorial GuineaEritreaEstoniaEthiopiaFijiFinlandFranceGabonGambia, TheGeorgiaGhanaGreeceGrenadaGuatemalaGuineaGuinea-BissauGuyanaHaitiHeavily indebted poor countries (HIPC)HondurasHong Kong SAR, ChinaHungaryIBRD onlyIcelandIDA blendIDA onlyIDA totalIndiaIndonesiaIran, Islamic Rep.IraqIrelandIsraelItalyJamaicaJapanJordanKenyaKiribatiKorea, Rep.KuwaitLao PDRLate-demographic dividendLatviaLeast developed countries: UN classificationLebanonLesothoLiberiaLibyaLiechtensteinLow incomeLower middle incomeLuxembourgMacao SAR, ChinaMadagascarMalawiMalaysiaMaldivesMaliMaltaMarshall IslandsMauritaniaMauritiusMexicoMiddle East & North AfricaMiddle East & North Africa (excluding high income)Middle East & North Africa (IDA & IBRD countries)MonacoMontenegroMoroccoMozambiqueMyanmarNamibiaNepalNetherlandsNicaraguaNigerNigeriaNorwayOmanOther small statesPacific island small statesPakistanPanamaPapua New GuineaParaguayPeruPhilippinesPolandPortugalPre-demographic dividendQatarRwandaSamoaSan MarinoSao Tome and PrincipeSaudi ArabiaSenegalSeychellesSierra LeoneSingaporeSloveniaSolomon IslandsSouth AfricaSouth AsiaSouth Asia (IDA & IBRD)SpainSri LankaSt. Kitts and NevisSt. LuciaSt. Vincent and the GrenadinesSub-Saharan Africa Sub-Saharan Africa (excluding high income)Sub-Saharan Africa (IDA & IBRD countries)SudanSurinameSwazilandSwedenSwitzerlandSyrian Arab RepublicTanzaniaThailandTimor-LesteTogoTongaTrinidad and TobagoTunisiaTurkeyTuvaluUgandaUnited Arab EmiratesUpper middle incomeUruguayVanuatuVenezuela, RBVietnamYemen, Rep.ZambiaZimbabwe línea de tiempo (timeline):
En esta escala de tiempo se presenta un gráfico de 1972 y 2014 de Ecuador. Los datos de 1971 están ausentes. El número de observaciones reales por fecha: 34.
Fuente (nombre):
Indicadores del desarrollo mundial
Fuente (organización):
UNESCO Institute for Statistics
Categorías:
Education
Se ha actualizado:
23 abr 2017 año
Los indicadores de los cambios de valor en los últimos años
Mínimo:
41.848
1 ene 1972 año
Máximo:
92.123
1 ene 2011 año
A la fecha de observación
Valor
Cambio absoluto
El cambio con respecto al valor anterior
1 ene 1972 año
41.848
+41.848
0.0%
1 ene 1973 año
43.611
+1.762
4.21%
1 ene 1974 año
44.366
+0.755
1.73%
1 ene 1975 año
45.042
+0.676
1.52%
1 ene 1976 año
49.331
+4.289
9.52%
1 ene 1977 año
50.688
+1.357
2.75%
1 ene 1978 año
51.924
+1.236
2.44%
1 ene 1979 año
51.432
-0.492
-0.95%
1 ene 1980 año
51.172
-0.26
-0.5%
1 ene 1981 año
54.144
+2.972
5.81%
1 ene 1982 año
55.094
+0.949
1.75%
1 ene 1983 año
58.485
+3.391
6.16%
1 ene 1984 año
60.811
+2.326
3.98%
1 ene 1985 año
62.606
+1.794
2.95%
1 ene 1986 año
64.125
+1.52
2.43%
1 ene 1988 año
61.082
-3.044
-4.75%
1 ene 1989 año
62.196
+1.114
1.82%
1 ene 1995 año
70.548
+8.352
13.43%
1 ene 1996 año
69.893
-0.655
-0.93%
1 ene 1997 año
71.037
+1.145
1.64%
1 ene 1998 año
72.157
+1.12
1.58%
1 ene 1999 año
77.604
+5.446
7.55%
1 ene 2000 año
77.013
-0.591
-0.76%
1 ene 2001 año
77.85
+0.837
1.09%
1 ene 2002 año
78.023
+0.173
0.22%
1 ene 2003 año
74.41
-3.614
-4.63%
1 ene 2004 año
76.269
+1.859
2.5%
1 ene 2005 año
76.329
+0.06
0.08%
1 ene 2006 año
77.289
+0.96
1.26%
1 ene 2007 año
81.701
+4.412
5.71%
1 ene 2011 año
92.123
+10.422
12.76%
1 ene 2012 año
91.749
-0.373
-0.41%
1 ene 2013 año
88.864
-2.886
-3.15%
1 ene 2014 año
90.591
+1.727
1.94%
Ranking de los países por los datos estadísticos actuales


Comentarios: