29
/es/
es
AIzaSyAYiBZKx7MnpbEhh9jyipgxe19OcubqV5w
April 1, 2024
258778
Syrian Arab Republic
SYR
true
2
1
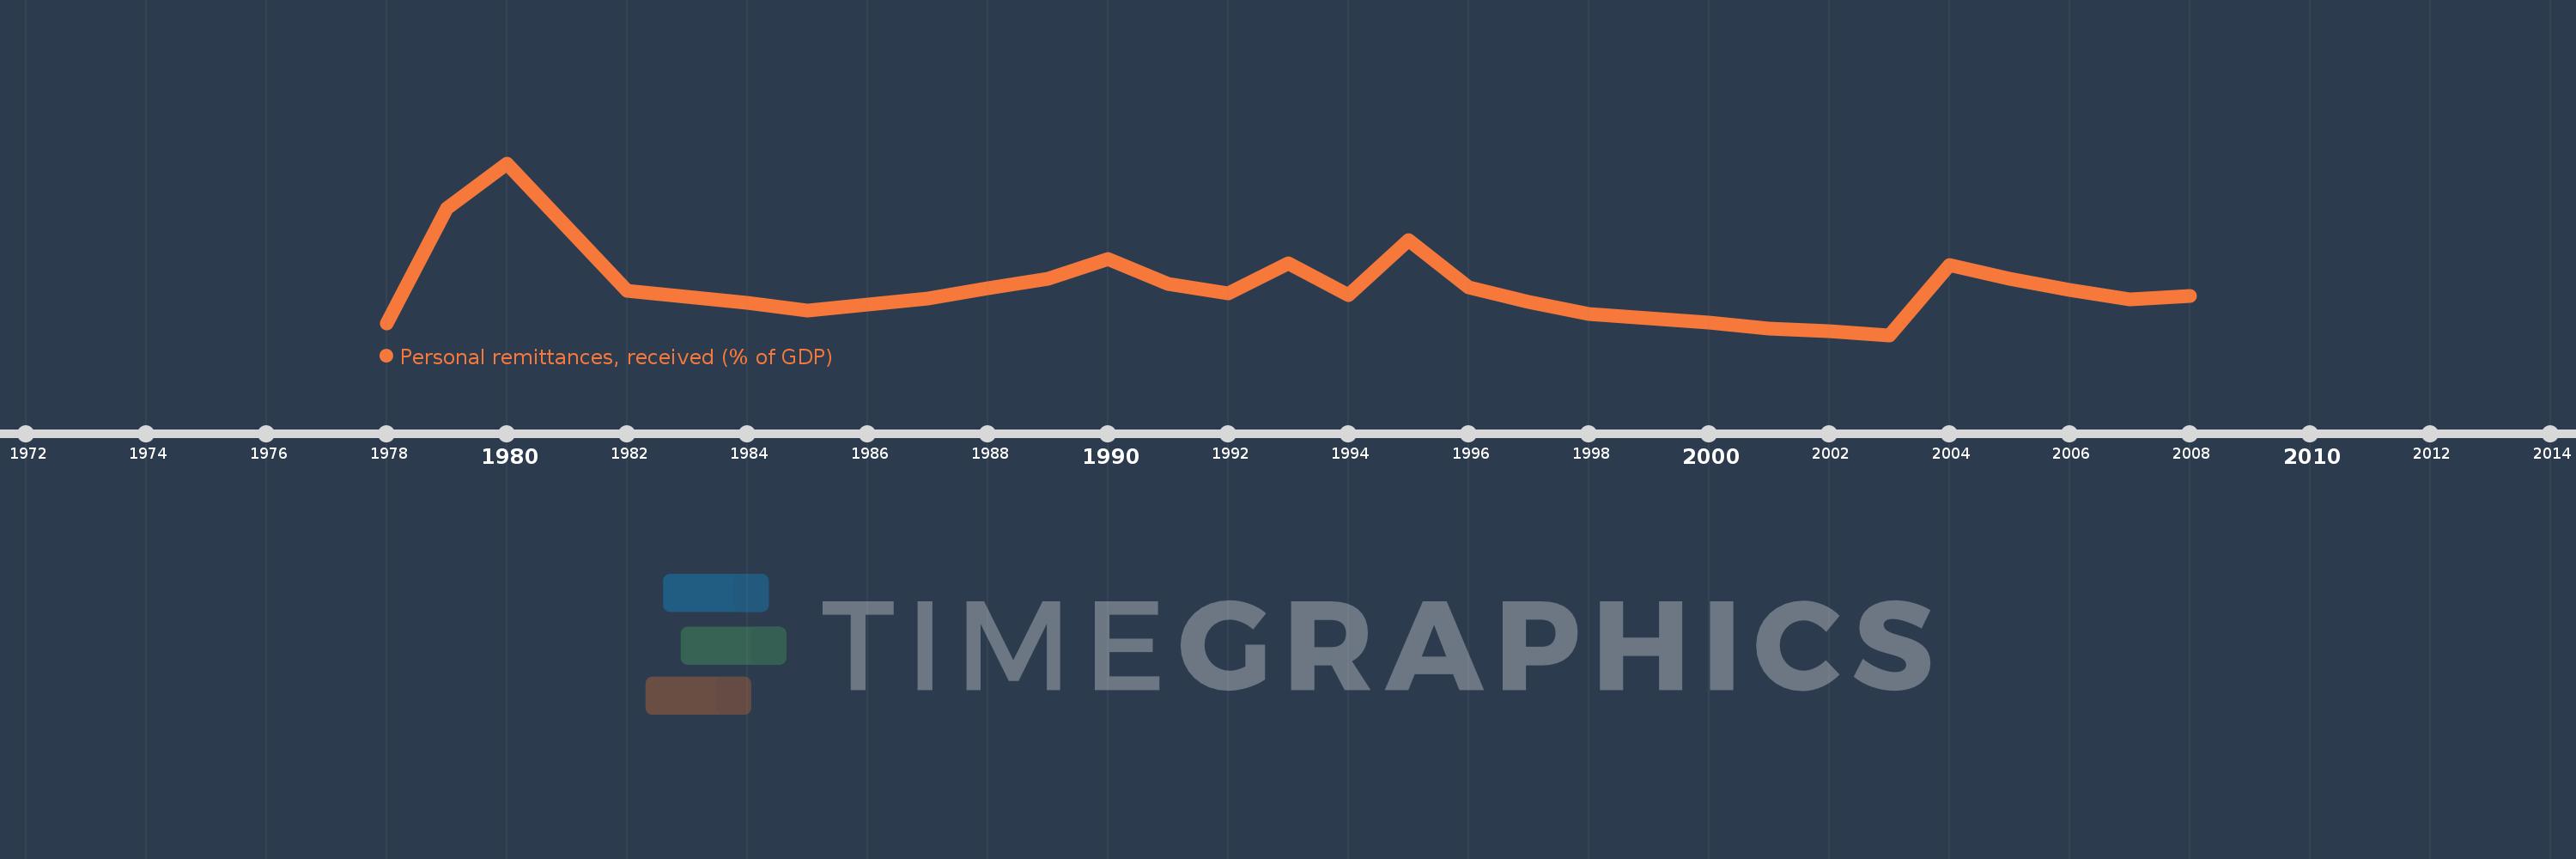
Personal remittances, received (% of GDP)
2008,2007,2006,2005,2004,2003,2002,2001,2000,1999,1998,1997,1996,1995,1994,1993,1992,1991,1990,1989,1988,1987,1986,1985,1984,1983,1982,1981,1980,1979,1978
Estas estadísticas en otros países:
AfghanistanAlbaniaAlgeriaAngolaAntigua and BarbudaArab WorldArgentinaArmeniaArubaAustraliaAustriaAzerbaijanBangladeshBarbadosBelarusBelgiumBelizeBeninBermudaBhutanBoliviaBosnia and HerzegovinaBotswanaBrazilBulgariaBurkina FasoBurundiCabo VerdeCambodiaCameroonCanadaCaribbean small statesCentral African RepublicCentral Europe and the BalticsChadChileChinaColombiaComorosCongo, Dem. Rep.Congo, Rep.Costa RicaCote d'IvoireCroatiaCyprusCzech RepublicDenmarkDjiboutiDominicaDominican RepublicEarly-demographic dividendEast Asia & PacificEast Asia & Pacific (excluding high income)East Asia & Pacific (IDA & IBRD countries)EcuadorEgypt, Arab Rep.El SalvadorEquatorial GuineaEritreaEstoniaEthiopiaEuro areaEurope & Central AsiaEurope & Central Asia (excluding high income)Europe & Central Asia (IDA & IBRD countries)European UnionFaroe IslandsFijiFinlandFragile and conflict affected situationsFranceGabonGambia, TheGeorgiaGermanyGhanaGreeceGrenadaGuatemalaGuineaGuinea-BissauGuyanaHaitiHeavily indebted poor countries (HIPC)High incomeHondurasHong Kong SAR, ChinaHungaryIBRD onlyIcelandIDA & IBRD totalIDA blendIDA onlyIDA totalIndiaIndonesiaIran, Islamic Rep.IraqIrelandIsraelItalyJamaicaJapanJordanKazakhstanKenyaKiribatiKorea, Rep.KosovoKuwaitKyrgyz RepublicLao PDRLate-demographic dividendLatin America & Caribbean Latin America & Caribbean (excluding high income)Latin America & the Caribbean (IDA & IBRD countries)LatviaLeast developed countries: UN classificationLebanonLesothoLiberiaLibyaLithuaniaLow & middle incomeLow incomeLower middle incomeLuxembourgMacao SAR, ChinaMacedonia, FYRMadagascarMalawiMalaysiaMaldivesMaliMaltaMarshall IslandsMauritaniaMauritiusMexicoMicronesia, Fed. Sts.Middle East & North AfricaMiddle East & North Africa (excluding high income)Middle East & North Africa (IDA & IBRD countries)Middle incomeMoldovaMongoliaMontenegroMoroccoMozambiqueMyanmarNamibiaNepalNetherlandsNew ZealandNicaraguaNigerNigeriaNorth AmericaNorwayOECD membersOmanOther small statesPacific island small statesPakistanPalauPanamaPapua New GuineaParaguayPeruPhilippinesPolandPortugalPost-demographic dividendPre-demographic dividendQatarRomaniaRussian FederationRwandaSamoaSao Tome and PrincipeSaudi ArabiaSenegalSerbiaSeychellesSierra LeoneSlovak RepublicSloveniaSmall statesSolomon IslandsSouth AfricaSouth AsiaSouth Asia (IDA & IBRD)South SudanSpainSri LankaSt. Kitts and NevisSt. LuciaSt. Vincent and the GrenadinesSub-Saharan Africa Sub-Saharan Africa (excluding high income)Sub-Saharan Africa (IDA & IBRD countries)SudanSurinameSwazilandSwedenSwitzerlandSyrian Arab RepublicTajikistanTanzaniaThailandTimor-LesteTogoTongaTrinidad and TobagoTunisiaTurkeyTurkmenistanTuvaluUgandaUkraineUnited KingdomUnited StatesUpper middle incomeUruguayUzbekistanVanuatuVenezuela, RBVietnamWest Bank and GazaWorldYemen, Rep.ZambiaZimbabwe línea de tiempo (timeline):
En esta escala de tiempo se presenta un gráfico de 1978 y 2008 de Syrian Arab Republic. Los datos de 1977 están ausentes. El número de observaciones reales por fecha: 31.
Fuente (nombre):
Indicadores del desarrollo mundial
Fuente (organización):
World Bank staff estimates based on IMF balance of payments data, and World Bank and OECD GDP estimates.
Categorías:
Economy & Growth, Financial Sector
Se ha actualizado:
23 abr 2017 año
Los indicadores de los cambios de valor en los últimos años
Mínimo:
0.626
1 ene 2003 año
Máximo:
9.078
1 ene 1980 año
A la fecha de observación
Valor
Cambio absoluto
El cambio con respecto al valor anterior
1 ene 1978 año
1.201
+1.201
0.0%
1 ene 1979 año
6.856
+5.655
470.72%
1 ene 1980 año
9.078
+2.222
32.41%
1 ene 1981 año
5.922
-3.156
-34.77%
1 ene 1982 año
2.81
-3.112
-52.55%
1 ene 1983 año
2.52
-0.29
-10.31%
1 ene 1984 año
2.197
-0.322
-12.8%
1 ene 1985 año
1.836
-0.361
-16.43%
1 ene 1986 año
2.131
+0.295
16.07%
1 ene 1987 año
2.43
+0.299
14.01%
1 ene 1988 año
2.941
+0.511
21.04%
1 ene 1989 año
3.404
+0.462
15.72%
1 ene 1990 año
4.364
+0.96
28.22%
1 ene 1991 año
3.128
-1.236
-28.32%
1 ene 1992 año
2.696
-0.432
-13.81%
1 ene 1993 año
4.15
+1.454
53.92%
1 ene 1994 año
2.57
-1.58
-38.07%
1 ene 1995 año
5.286
+2.715
105.65%
1 ene 1996 año
2.975
-2.311
-43.72%
1 ene 1997 año
2.27
-0.705
-23.69%
1 ene 1998 año
1.641
-0.629
-27.71%
1 ene 1999 año
1.447
-0.193
-11.79%
1 ene 2000 año
1.247
-0.2
-13.82%
1 ene 2001 año
0.931
-0.316
-25.33%
1 ene 2002 año
0.806
-0.126
-13.5%
1 ene 2003 año
0.626
-0.18
-22.36%
1 ene 2004 año
4.073
+3.447
551.1%
1 ene 2005 año
3.408
-0.665
-16.32%
1 ene 2006 año
2.852
-0.556
-16.32%
1 ene 2007 año
2.385
-0.467
-16.37%
1 ene 2008 año
2.55
+0.165
6.93%
Ranking de los países por los datos estadísticos actuales


Comentarios: