29
/es/
es
AIzaSyAYiBZKx7MnpbEhh9jyipgxe19OcubqV5w
April 1, 2024
121341
Dominica
DMA
true
2
1
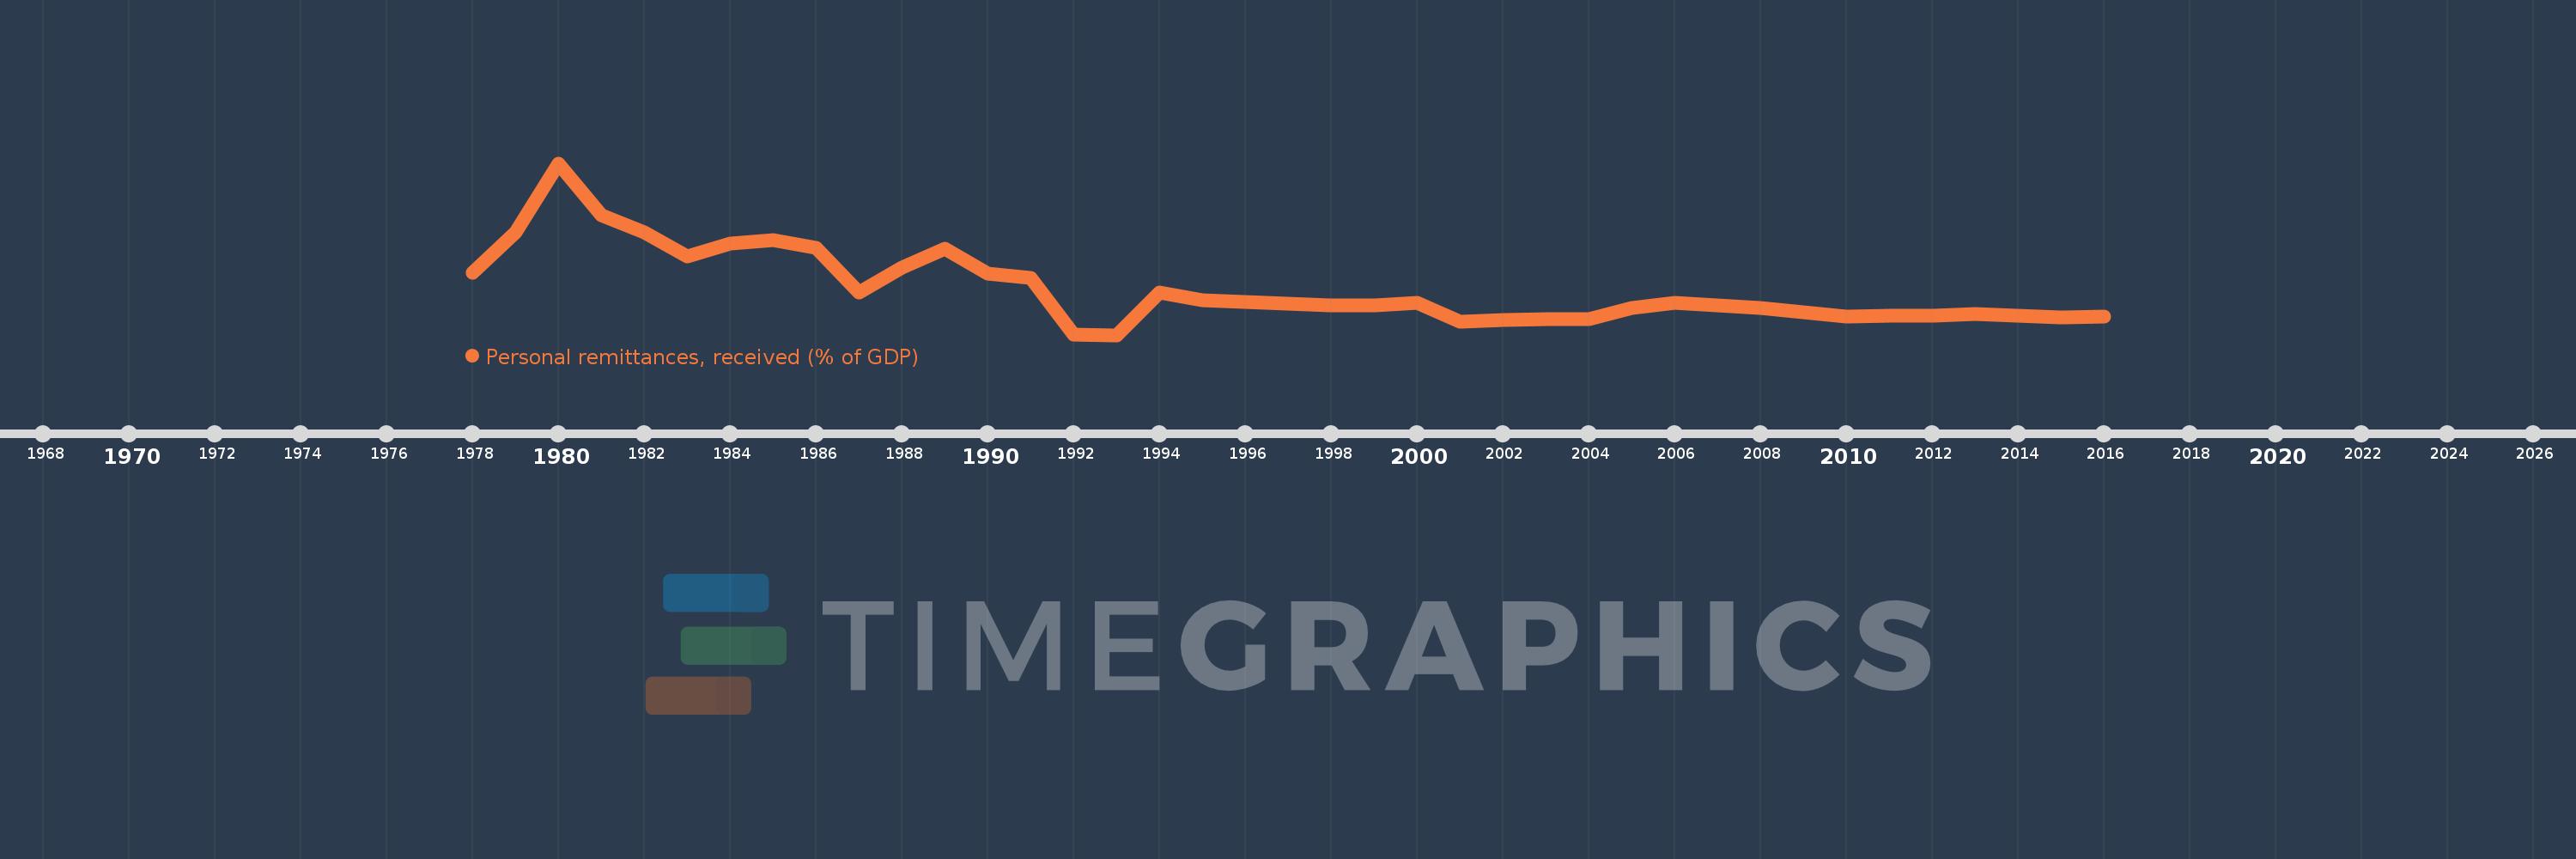
Personal remittances, received (% of GDP)
2016,2015,2014,2013,2012,2011,2010,2009,2008,2007,2006,2005,2004,2003,2002,2001,2000,1999,1998,1997,1996,1995,1994,1993,1992,1991,1990,1989,1988,1987,1986,1985,1984,1983,1982,1981,1980,1979,1978
Estas estadísticas en otros países:
AfghanistanAlbaniaAlgeriaAngolaAntigua and BarbudaArab WorldArgentinaArmeniaArubaAustraliaAustriaAzerbaijanBangladeshBarbadosBelarusBelgiumBelizeBeninBermudaBhutanBoliviaBosnia and HerzegovinaBotswanaBrazilBulgariaBurkina FasoBurundiCabo VerdeCambodiaCameroonCanadaCaribbean small statesCentral African RepublicCentral Europe and the BalticsChadChileChinaColombiaComorosCongo, Dem. Rep.Congo, Rep.Costa RicaCote d'IvoireCroatiaCyprusCzech RepublicDenmarkDjiboutiDominicaDominican RepublicEarly-demographic dividendEast Asia & PacificEast Asia & Pacific (excluding high income)East Asia & Pacific (IDA & IBRD countries)EcuadorEgypt, Arab Rep.El SalvadorEquatorial GuineaEritreaEstoniaEthiopiaEuro areaEurope & Central AsiaEurope & Central Asia (excluding high income)Europe & Central Asia (IDA & IBRD countries)European UnionFaroe IslandsFijiFinlandFragile and conflict affected situationsFranceGabonGambia, TheGeorgiaGermanyGhanaGreeceGrenadaGuatemalaGuineaGuinea-BissauGuyanaHaitiHeavily indebted poor countries (HIPC)High incomeHondurasHong Kong SAR, ChinaHungaryIBRD onlyIcelandIDA & IBRD totalIDA blendIDA onlyIDA totalIndiaIndonesiaIran, Islamic Rep.IraqIrelandIsraelItalyJamaicaJapanJordanKazakhstanKenyaKiribatiKorea, Rep.KosovoKuwaitKyrgyz RepublicLao PDRLate-demographic dividendLatin America & Caribbean Latin America & Caribbean (excluding high income)Latin America & the Caribbean (IDA & IBRD countries)LatviaLeast developed countries: UN classificationLebanonLesothoLiberiaLibyaLithuaniaLow & middle incomeLow incomeLower middle incomeLuxembourgMacao SAR, ChinaMacedonia, FYRMadagascarMalawiMalaysiaMaldivesMaliMaltaMarshall IslandsMauritaniaMauritiusMexicoMicronesia, Fed. Sts.Middle East & North AfricaMiddle East & North Africa (excluding high income)Middle East & North Africa (IDA & IBRD countries)Middle incomeMoldovaMongoliaMontenegroMoroccoMozambiqueMyanmarNamibiaNepalNetherlandsNew ZealandNicaraguaNigerNigeriaNorth AmericaNorwayOECD membersOmanOther small statesPacific island small statesPakistanPalauPanamaPapua New GuineaParaguayPeruPhilippinesPolandPortugalPost-demographic dividendPre-demographic dividendQatarRomaniaRussian FederationRwandaSamoaSao Tome and PrincipeSaudi ArabiaSenegalSerbiaSeychellesSierra LeoneSlovak RepublicSloveniaSmall statesSolomon IslandsSouth AfricaSouth AsiaSouth Asia (IDA & IBRD)South SudanSpainSri LankaSt. Kitts and NevisSt. LuciaSt. Vincent and the GrenadinesSub-Saharan Africa Sub-Saharan Africa (excluding high income)Sub-Saharan Africa (IDA & IBRD countries)SudanSurinameSwazilandSwedenSwitzerlandSyrian Arab RepublicTajikistanTanzaniaThailandTimor-LesteTogoTongaTrinidad and TobagoTunisiaTurkeyTurkmenistanTuvaluUgandaUkraineUnited KingdomUnited StatesUpper middle incomeUruguayUzbekistanVanuatuVenezuela, RBVietnamWest Bank and GazaWorldYemen, Rep.ZambiaZimbabwe línea de tiempo (timeline):
En esta escala de tiempo se presenta un gráfico de 1978 y 2016 de Dominica. Los datos de 1977 están ausentes. El número de observaciones reales por fecha: 39.
Fuente (nombre):
Indicadores del desarrollo mundial
Fuente (organización):
World Bank staff estimates based on IMF balance of payments data, and World Bank and OECD GDP estimates.
Categorías:
Economy & Growth, Financial Sector
Se ha actualizado:
23 abr 2017 año
Los indicadores de los cambios de valor en los últimos años
Mínimo:
2.698
1 ene 1993 año
Máximo:
19.64
1 ene 1980 año
A la fecha de observación
Valor
Cambio absoluto
El cambio con respecto al valor anterior
1 ene 1978 año
8.798
+8.798
0.0%
1 ene 1979 año
12.84
+4.042
45.94%
1 ene 1980 año
19.64
+6.8
52.96%
1 ene 1981 año
14.552
-5.089
-25.91%
1 ene 1982 año
12.836
-1.715
-11.79%
1 ene 1983 año
10.409
-2.427
-18.91%
1 ene 1984 año
11.761
+1.352
12.99%
1 ene 1985 año
12.02
+0.259
2.21%
1 ene 1986 año
11.259
-0.761
-6.33%
1 ene 1987 año
6.874
-4.386
-38.95%
1 ene 1988 año
9.322
+2.448
35.61%
1 ene 1989 año
11.206
+1.885
20.22%
1 ene 1990 año
8.717
-2.489
-22.21%
1 ene 1991 año
8.371
-0.347
-3.98%
1 ene 1992 año
2.748
-5.622
-67.17%
1 ene 1993 año
2.698
-0.05
-1.83%
1 ene 1994 año
6.854
+4.156
154.03%
1 ene 1995 año
6.166
-0.688
-10.04%
1 ene 1996 año
5.996
-0.17
-2.76%
1 ene 1997 año
5.816
-0.18
-3.0%
1 ene 1998 año
5.651
-0.165
-2.84%
1 ene 1999 año
5.658
+0.007
0.12%
1 ene 2000 año
5.843
+0.185
3.27%
1 ene 2001 año
4.026
-1.817
-31.09%
1 ene 2002 año
4.18
+0.154
3.82%
1 ene 2003 año
4.281
+0.101
2.42%
1 ene 2004 año
4.229
-0.052
-1.23%
1 ene 2005 año
5.345
+1.116
26.39%
1 ene 2006 año
5.879
+0.534
9.98%
1 ene 2007 año
5.655
-0.224
-3.8%
1 ene 2008 año
5.336
-0.319
-5.65%
1 ene 2009 año
4.951
-0.384
-7.2%
1 ene 2010 año
4.527
-0.425
-8.58%
1 ene 2011 año
4.635
+0.108
2.4%
1 ene 2012 año
4.565
-0.07
-1.51%
1 ene 2013 año
4.785
+0.22
4.81%
1 ene 2014 año
4.632
-0.153
-3.19%
1 ene 2015 año
4.459
-0.173
-3.74%
1 ene 2016 año
4.553
+0.094
2.12%
Ranking de los países por los datos estadísticos actuales


Comentarios: