30
/es/
AIzaSyAYiBZKx7MnpbEhh9jyipgxe19OcubqV5w
April 1, 2024
258758
Syrian Arab Republic
SYR
true
2
1
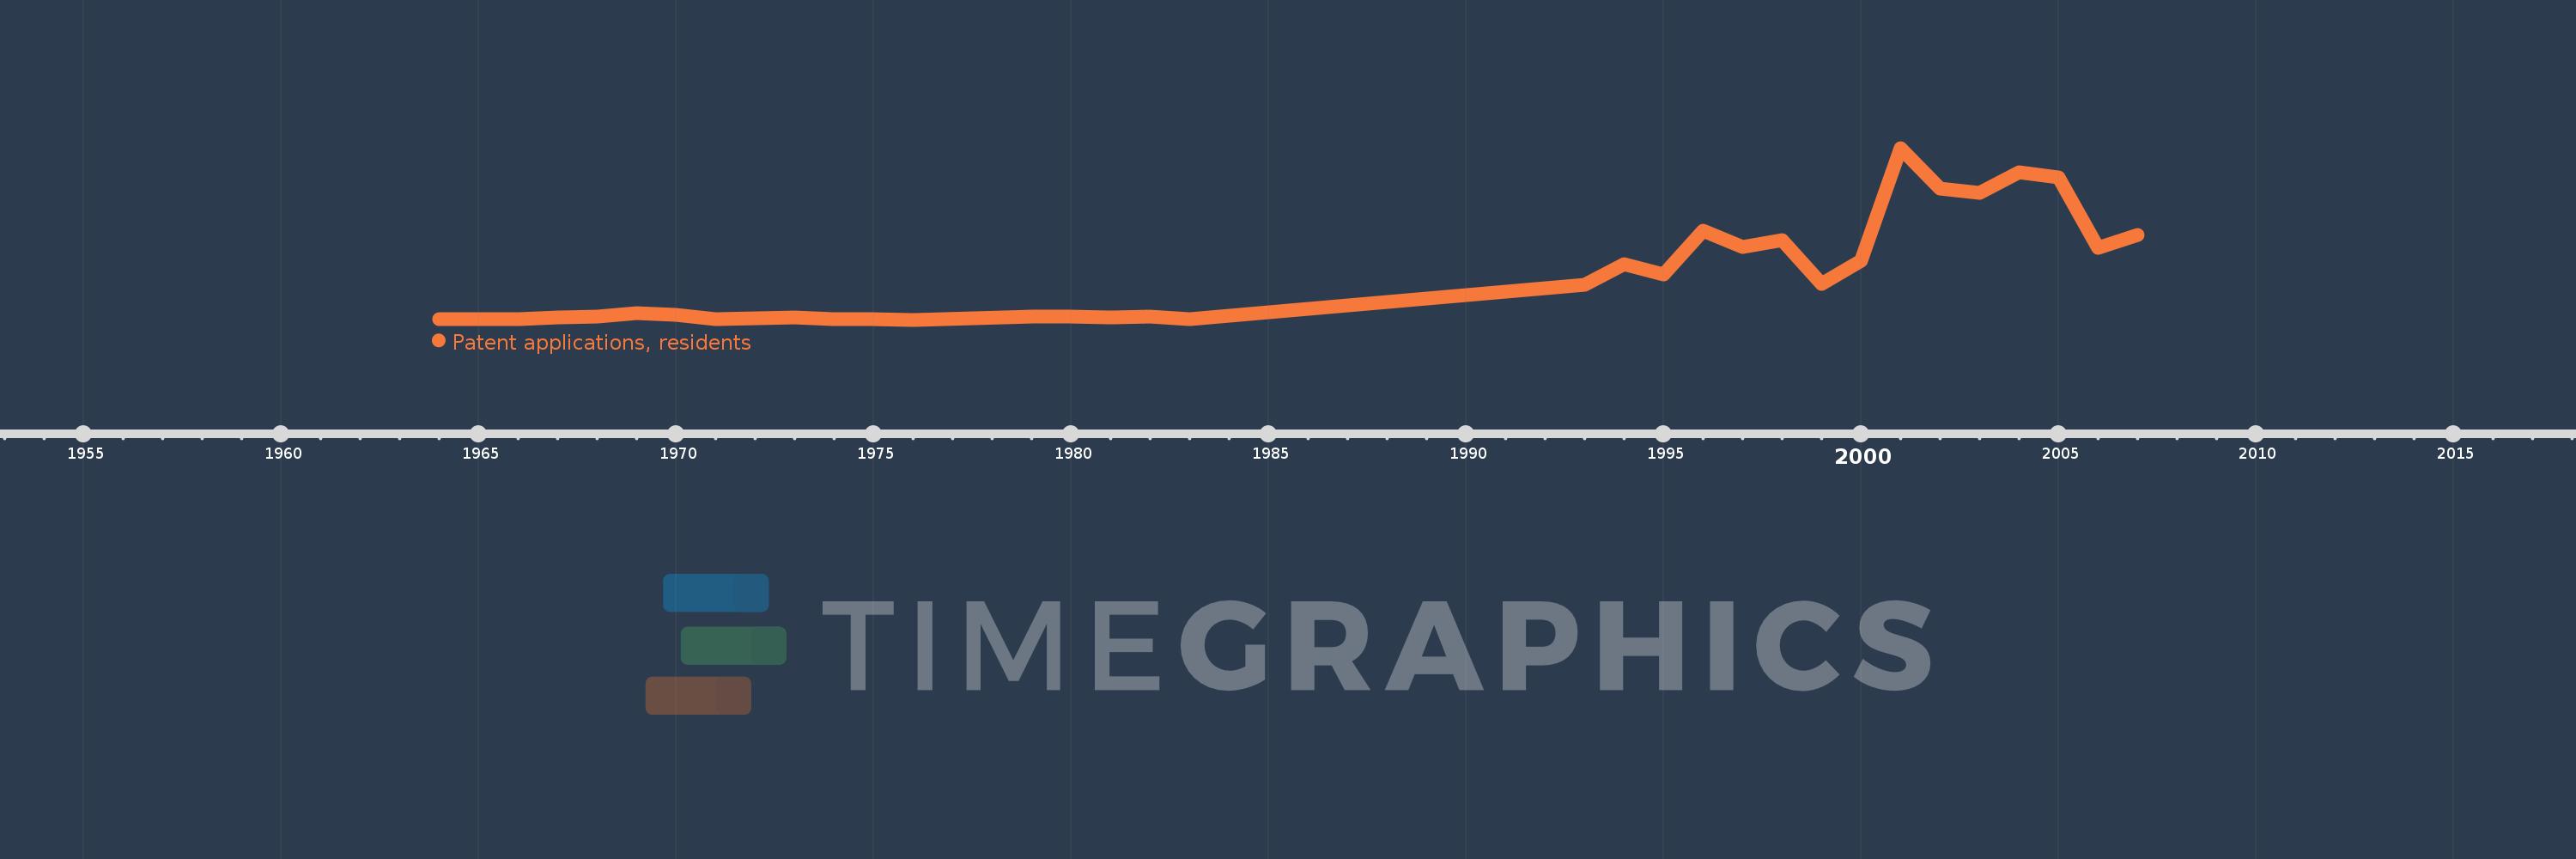
Patent applications, residents
2007,2006,2005,2004,2003,2002,2001,2000,1999,1998,1997,1996,1995,1994,1993,1983,1982,1981,1980,1979,1976,1975,1974,1973,1972,1971,1970,1969,1968,1967,1966,1964
