29
/es/
es
AIzaSyAYiBZKx7MnpbEhh9jyipgxe19OcubqV5w
April 1, 2024
196021
Mexico
MEX
true
2
1
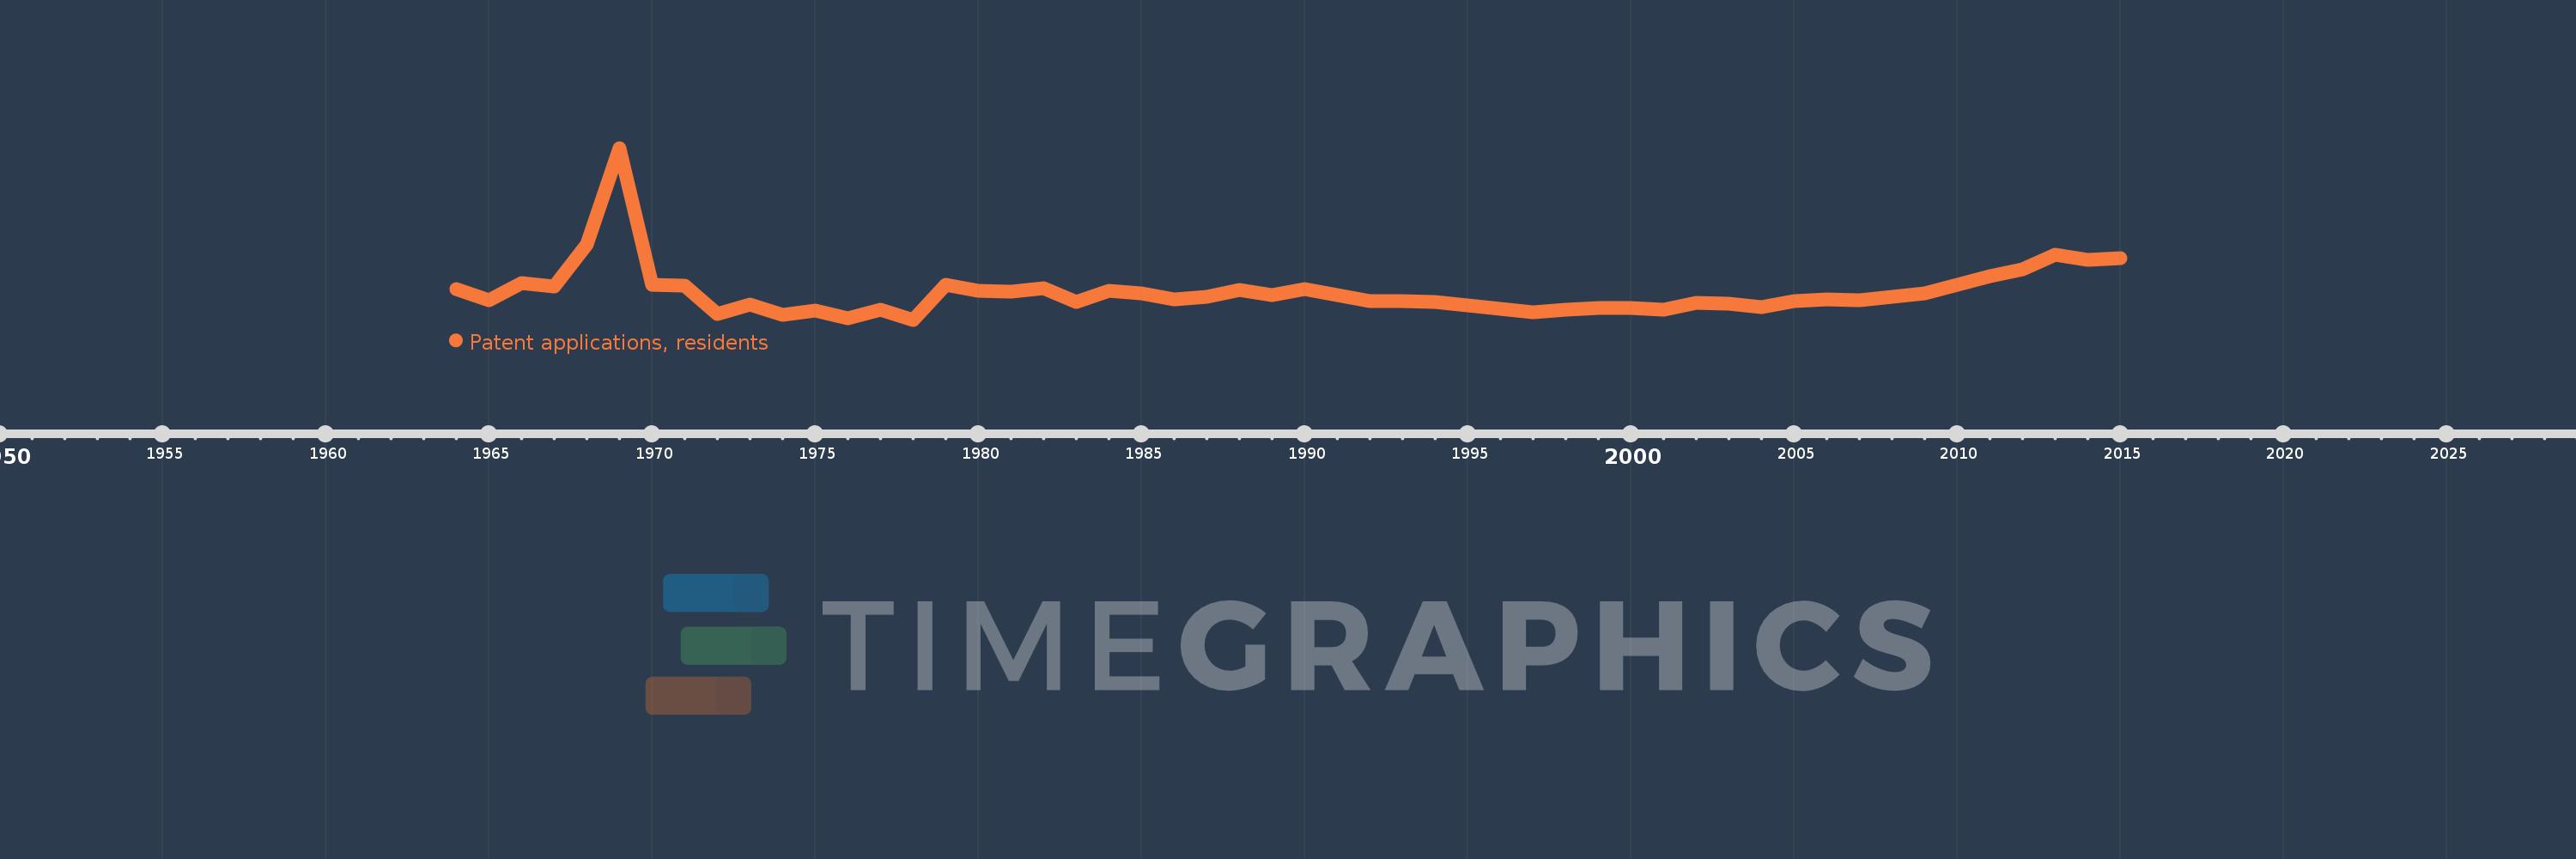
Patent applications, residents
2015,2014,2013,2012,2011,2010,2009,2008,2007,2006,2005,2004,2003,2002,2001,2000,1999,1998,1997,1996,1995,1994,1993,1992,1991,1990,1989,1988,1987,1986,1985,1984,1983,1982,1981,1980,1979,1978,1977,1976,1975,1974,1973,1972,1971,1970,1969,1968,1967,1966,1965,1964
Estas estadísticas en otros países:
AlbaniaAlgeriaAngolaArab WorldArgentinaArmeniaArubaAustraliaAustriaAzerbaijanBahamas, TheBahrainBangladeshBarbadosBelarusBelgiumBelizeBhutanBoliviaBosnia and HerzegovinaBotswanaBrazilBrunei DarussalamBulgariaBurkina FasoBurundiCambodiaCanadaCaribbean small statesCentral Europe and the BalticsChileChinaColombiaCongo, Dem. Rep.Congo, Rep.Costa RicaCote d'IvoireCroatiaCubaCyprusCzech RepublicDenmarkDjiboutiDominican RepublicEarly-demographic dividendEast Asia & PacificEast Asia & Pacific (excluding high income)East Asia & Pacific (IDA & IBRD countries)EcuadorEgypt, Arab Rep.El SalvadorEstoniaEthiopiaEuro areaEurope & Central AsiaEurope & Central Asia (excluding high income)Europe & Central Asia (IDA & IBRD countries)European UnionFijiFinlandFranceGeorgiaGermanyGreeceGuatemalaGuyanaHaitiHigh incomeHondurasHong Kong SAR, ChinaHungaryIBRD onlyIcelandIDA & IBRD totalIDA blendIndiaIndonesiaIran, Islamic Rep.IraqIrelandIsraelItalyJamaicaJapanJordanKazakhstanKenyaKiribatiKorea, Dem. People’s Rep.Korea, Rep.KuwaitKyrgyz RepublicLao PDRLate-demographic dividendLatin America & Caribbean Latin America & Caribbean (excluding high income)Latin America & the Caribbean (IDA & IBRD countries)LatviaLebanonLesothoLiberiaLibyaLithuaniaLow & middle incomeLower middle incomeLuxembourgMacao SAR, ChinaMacedonia, FYRMadagascarMalawiMalaysiaMaliMaltaMauritiusMexicoMiddle East & North AfricaMiddle East & North Africa (excluding high income)Middle East & North Africa (IDA & IBRD countries)Middle incomeMoldovaMonacoMongoliaMontenegroMoroccoMozambiqueNamibiaNepalNetherlandsNew ZealandNicaraguaNigeriaNorth AmericaNorwayOECD membersPakistanPanamaPapua New GuineaParaguayPeruPhilippinesPolandPortugalPost-demographic dividendQatarRomaniaRussian FederationRwandaSamoaSaudi ArabiaSerbiaSierra LeoneSingaporeSlovak RepublicSloveniaSomaliaSouth AfricaSouth AsiaSouth Asia (IDA & IBRD)SpainSri LankaSudanSwazilandSwedenSwitzerlandSyrian Arab RepublicTajikistanTanzaniaThailandTrinidad and TobagoTunisiaTurkeyTurkmenistanUgandaUkraineUnited Arab EmiratesUnited KingdomUnited StatesUpper middle incomeUruguayUzbekistanVenezuela, RBVietnamWorldYemen, Rep.ZambiaZimbabwe línea de tiempo (timeline):
En esta escala de tiempo se presenta un gráfico de 1964 y 2015 de Mexico. Los datos de 1963 están ausentes. El número de observaciones reales por fecha: 52.
Fuente (nombre):
Indicadores del desarrollo mundial
Fuente (organización):
World Intellectual Property Organization (WIPO), WIPO Patent Report: Statistics on Worldwide Patent Activity. The International Bureau of WIPO assumes no responsibility with respect to the transformation of these data.
Categorías:
Science & Technology
Se ha actualizado:
23 abr 2017 año
Los indicadores de los cambios de valor en los últimos años
Mínimo:
266.0
1 ene 1978 año
Máximo:
2.983 mil
1 ene 1969 año
A la fecha de observación
Valor
Cambio absoluto
El cambio con respecto al valor anterior
1 ene 1964 año
750.0
+750.0
0.0%
1 ene 1965 año
581.0
-169.0
-22.53%
1 ene 1966 año
849.0
+268.0
46.13%
1 ene 1967 año
785.0
-64.0
-7.54%
1 ene 1968 año
1.451 mil
+666.0
84.84%
1 ene 1969 año
2.983 mil
+1.532 mil
105.58%
1 ene 1970 año
823.0
-2.16 mil
-72.41%
1 ene 1971 año
805.0
-18.0
-2.19%
1 ene 1972 año
353.0
-452.0
-56.15%
1 ene 1973 año
513.0
+160.0
45.33%
1 ene 1974 año
338.0
-175.0
-34.11%
1 ene 1975 año
418.0
+80.0
23.67%
1 ene 1976 año
284.0
-134.0
-32.06%
1 ene 1977 año
422.0
+138.0
48.59%
1 ene 1978 año
266.0
-156.0
-36.97%
1 ene 1979 año
817.0
+551.0
207.14%
1 ene 1980 año
726.0
-91.0
-11.14%
1 ene 1981 año
704.0
-22.0
-3.03%
1 ene 1982 año
765.0
+61.0
8.66%
1 ene 1983 año
550.0
-215.0
-28.1%
1 ene 1984 año
730.0
+180.0
32.73%
1 ene 1985 año
688.0
-42.0
-5.75%
1 ene 1986 año
590.0
-98.0
-14.24%
1 ene 1987 año
629.0
+39.0
6.61%
1 ene 1988 año
742.0
+113.0
17.97%
1 ene 1989 año
652.0
-90.0
-12.13%
1 ene 1990 año
757.0
+105.0
16.1%
1 ene 1991 año
661.0
-96.0
-12.68%
1 ene 1992 año
564.0
-97.0
-14.67%
1 ene 1993 año
565.0
+1.0
0.18%
1 ene 1994 año
553.0
-12.0
-2.12%
1 ene 1995 año
498.0
-55.0
-9.95%
1 ene 1996 año
432.0
-66.0
-13.25%
1 ene 1997 año
386.0
-46.0
-10.65%
1 ene 1998 año
420.0
+34.0
8.81%
1 ene 1999 año
453.0
+33.0
7.86%
1 ene 2000 año
455.0
+2.0
0.44%
1 ene 2001 año
431.0
-24.0
-5.27%
1 ene 2002 año
534.0
+103.0
23.9%
1 ene 2003 año
526.0
-8.0
-1.5%
1 ene 2004 año
468.0
-58.0
-11.03%
1 ene 2005 año
565.0
+97.0
20.73%
1 ene 2006 año
584.0
+19.0
3.36%
1 ene 2007 año
574.0
-10.0
-1.71%
1 ene 2008 año
629.0
+55.0
9.58%
1 ene 2009 año
685.0
+56.0
8.9%
1 ene 2010 año
822.0
+137.0
20.0%
1 ene 2011 año
951.0
+129.0
15.69%
1 ene 2012 año
1.065 mil
+114.0
11.99%
1 ene 2013 año
1.294 mil
+229.0
21.5%
1 ene 2014 año
1.21 mil
-84.0
-6.49%
1 ene 2015 año
1.246 mil
+36.0
2.98%
Ranking de los países por los datos estadísticos actuales


Comentarios: