29
/es/
es
AIzaSyAYiBZKx7MnpbEhh9jyipgxe19OcubqV5w
April 1, 2024
256916
Sweden
SWE
true
2
1
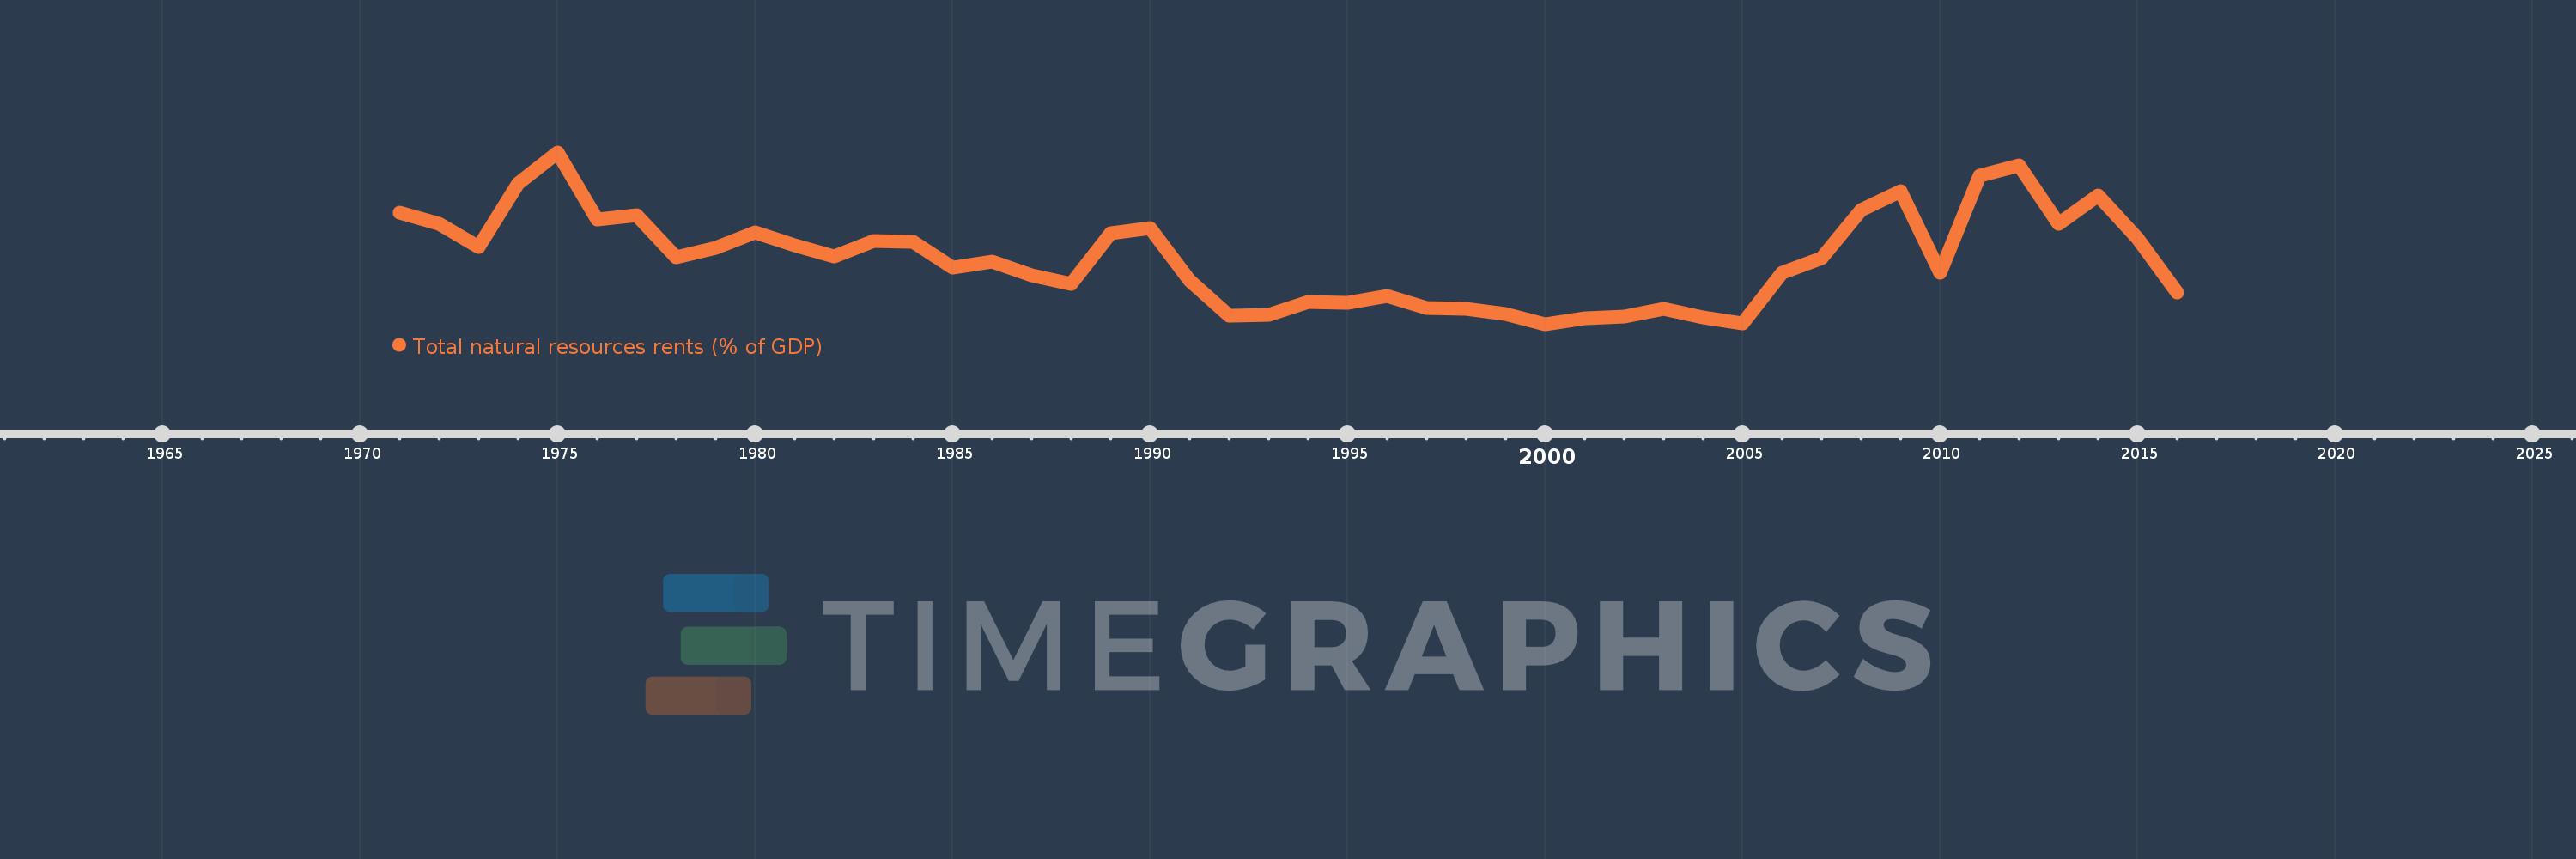
Total natural resources rents (% of GDP)
2016,2015,2014,2013,2012,2011,2010,2009,2008,2007,2006,2005,2004,2003,2002,2001,2000,1999,1998,1997,1996,1995,1994,1993,1992,1991,1990,1989,1988,1987,1986,1985,1984,1983,1982,1981,1980,1979,1978,1977,1976,1975,1974,1973,1972,1971
Estas estadísticas en otros países:
AfghanistanAlbaniaAlgeriaAngolaArab WorldArgentinaArmeniaArubaAustraliaAustriaAzerbaijanBahamas, TheBahrainBangladeshBarbadosBelarusBelgiumBelizeBeninBhutanBoliviaBosnia and HerzegovinaBotswanaBrazilBrunei DarussalamBulgariaBurkina FasoBurundiCabo VerdeCambodiaCameroonCanadaCaribbean small statesCentral African RepublicCentral Europe and the BalticsChadChileChinaColombiaComorosCongo, Dem. Rep.Congo, Rep.Costa RicaCote d'IvoireCroatiaCubaCyprusCzech RepublicDenmarkDjiboutiDominicaDominican RepublicEarly-demographic dividendEast Asia & PacificEast Asia & Pacific (excluding high income)East Asia & Pacific (IDA & IBRD countries)EcuadorEgypt, Arab Rep.El SalvadorEquatorial GuineaEritreaEstoniaEthiopiaEuro areaEurope & Central AsiaEurope & Central Asia (excluding high income)Europe & Central Asia (IDA & IBRD countries)European UnionFijiFinlandFragile and conflict affected situationsFranceFrench PolynesiaGabonGambia, TheGeorgiaGermanyGhanaGreeceGuatemalaGuineaGuinea-BissauGuyanaHaitiHeavily indebted poor countries (HIPC)High incomeHondurasHong Kong SAR, ChinaHungaryIBRD onlyIcelandIDA & IBRD totalIDA blendIDA onlyIDA totalIndiaIndonesiaIran, Islamic Rep.IraqIrelandIsraelItalyJamaicaJapanJordanKazakhstanKenyaKiribatiKorea, Rep.KuwaitKyrgyz RepublicLao PDRLate-demographic dividendLatin America & Caribbean Latin America & Caribbean (excluding high income)Latin America & the Caribbean (IDA & IBRD countries)LatviaLeast developed countries: UN classificationLebanonLesothoLiberiaLibyaLithuaniaLow & middle incomeLow incomeLower middle incomeLuxembourgMacao SAR, ChinaMacedonia, FYRMadagascarMalawiMalaysiaMaldivesMaliMaltaMauritaniaMauritiusMexicoMiddle East & North AfricaMiddle East & North Africa (excluding high income)Middle East & North Africa (IDA & IBRD countries)Middle incomeMoldovaMongoliaMontenegroMoroccoMozambiqueMyanmarNamibiaNepalNetherlandsNew CaledoniaNew ZealandNicaraguaNigerNigeriaNorth AmericaNorwayOECD membersOmanOther small statesPacific island small statesPakistanPanamaPapua New GuineaParaguayPeruPhilippinesPolandPortugalPost-demographic dividendPre-demographic dividendQatarRomaniaRussian FederationRwandaSamoaSao Tome and PrincipeSaudi ArabiaSenegalSerbiaSeychellesSierra LeoneSingaporeSlovak RepublicSloveniaSmall statesSolomon IslandsSouth AfricaSouth AsiaSouth Asia (IDA & IBRD)South SudanSpainSri LankaSt. LuciaSt. Vincent and the GrenadinesSub-Saharan Africa Sub-Saharan Africa (excluding high income)Sub-Saharan Africa (IDA & IBRD countries)SudanSurinameSwazilandSwedenSwitzerlandSyrian Arab RepublicTajikistanTanzaniaThailandTimor-LesteTogoTongaTrinidad and TobagoTunisiaTurkeyTurkmenistanUgandaUkraineUnited Arab EmiratesUnited KingdomUnited StatesUpper middle incomeUruguayUzbekistanVanuatuVenezuela, RBVietnamWorldYemen, Rep.ZambiaZimbabwe línea de tiempo (timeline):
En esta escala de tiempo se presenta un gráfico de 1971 y 2016 de Sweden. Los datos de 1970 están ausentes. El número de observaciones reales por fecha: 46.
Fuente (nombre):
Indicadores del desarrollo mundial
Fuente (organización):
Estimates based on sources and methods described in "The Changing Wealth of Nations: Measuring Sustainable Development in the New Millennium" (World Bank, 2011).
Categorías:
Energy & Mining, Environment
Se ha actualizado:
23 abr 2017 año
Los indicadores de los cambios de valor en los últimos años
Mínimo:
0.232
1 ene 2000 año
Máximo:
1.135
1 ene 1975 año
A la fecha de observación
Valor
Cambio absoluto
El cambio con respecto al valor anterior
1 ene 1971 año
0.818
+0.818
0.0%
1 ene 1972 año
0.76
-0.057
-7.02%
1 ene 1973 año
0.636
-0.124
-16.31%
1 ene 1974 año
0.971
+0.335
52.61%
1 ene 1975 año
1.135
+0.164
16.93%
1 ene 1976 año
0.783
-0.352
-31.0%
1 ene 1977 año
0.807
+0.024
3.02%
1 ene 1978 año
0.585
-0.222
-27.57%
1 ene 1979 año
0.635
+0.05
8.57%
1 ene 1980 año
0.713
+0.079
12.42%
1 ene 1981 año
0.646
-0.067
-9.42%
1 ene 1982 año
0.587
-0.059
-9.13%
1 ene 1983 año
0.668
+0.081
13.74%
1 ene 1984 año
0.664
-0.004
-0.6%
1 ene 1985 año
0.531
-0.133
-19.98%
1 ene 1986 año
0.562
+0.031
5.89%
1 ene 1987 año
0.489
-0.073
-13.05%
1 ene 1988 año
0.445
-0.044
-9.04%
1 ene 1989 año
0.711
+0.267
59.95%
1 ene 1990 año
0.736
+0.024
3.43%
1 ene 1991 año
0.461
-0.275
-37.36%
1 ene 1992 año
0.275
-0.186
-40.26%
1 ene 1993 año
0.279
+0.004
1.33%
1 ene 1994 año
0.351
+0.072
25.69%
1 ene 1995 año
0.346
-0.004
-1.25%
1 ene 1996 año
0.38
+0.033
9.62%
1 ene 1997 año
0.319
-0.061
-16.01%
1 ene 1998 año
0.314
-0.005
-1.58%
1 ene 1999 año
0.285
-0.029
-9.15%
1 ene 2000 año
0.232
-0.053
-18.58%
1 ene 2001 año
0.264
+0.032
13.57%
1 ene 2002 año
0.273
+0.009
3.4%
1 ene 2003 año
0.313
+0.04
14.64%
1 ene 2004 año
0.269
-0.043
-13.8%
1 ene 2005 año
0.238
-0.031
-11.6%
1 ene 2006 año
0.501
+0.263
110.38%
1 ene 2007 año
0.577
+0.076
15.11%
1 ene 2008 año
0.833
+0.257
44.49%
1 ene 2009 año
0.93
+0.096
11.55%
1 ene 2010 año
0.504
-0.426
-45.8%
1 ene 2011 año
1.013
+0.51
101.15%
1 ene 2012 año
1.066
+0.052
5.16%
1 ene 2013 año
0.759
-0.307
-28.76%
1 ene 2014 año
0.908
+0.148
19.53%
1 ene 2015 año
0.685
-0.222
-24.5%
1 ene 2016 año
0.397
-0.289
-42.14%
Ranking de los países por los datos estadísticos actuales


Comentarios: