29
/es/
es
AIzaSyAYiBZKx7MnpbEhh9jyipgxe19OcubqV5w
April 1, 2024
188579
Malaysia
MYS
true
2
1
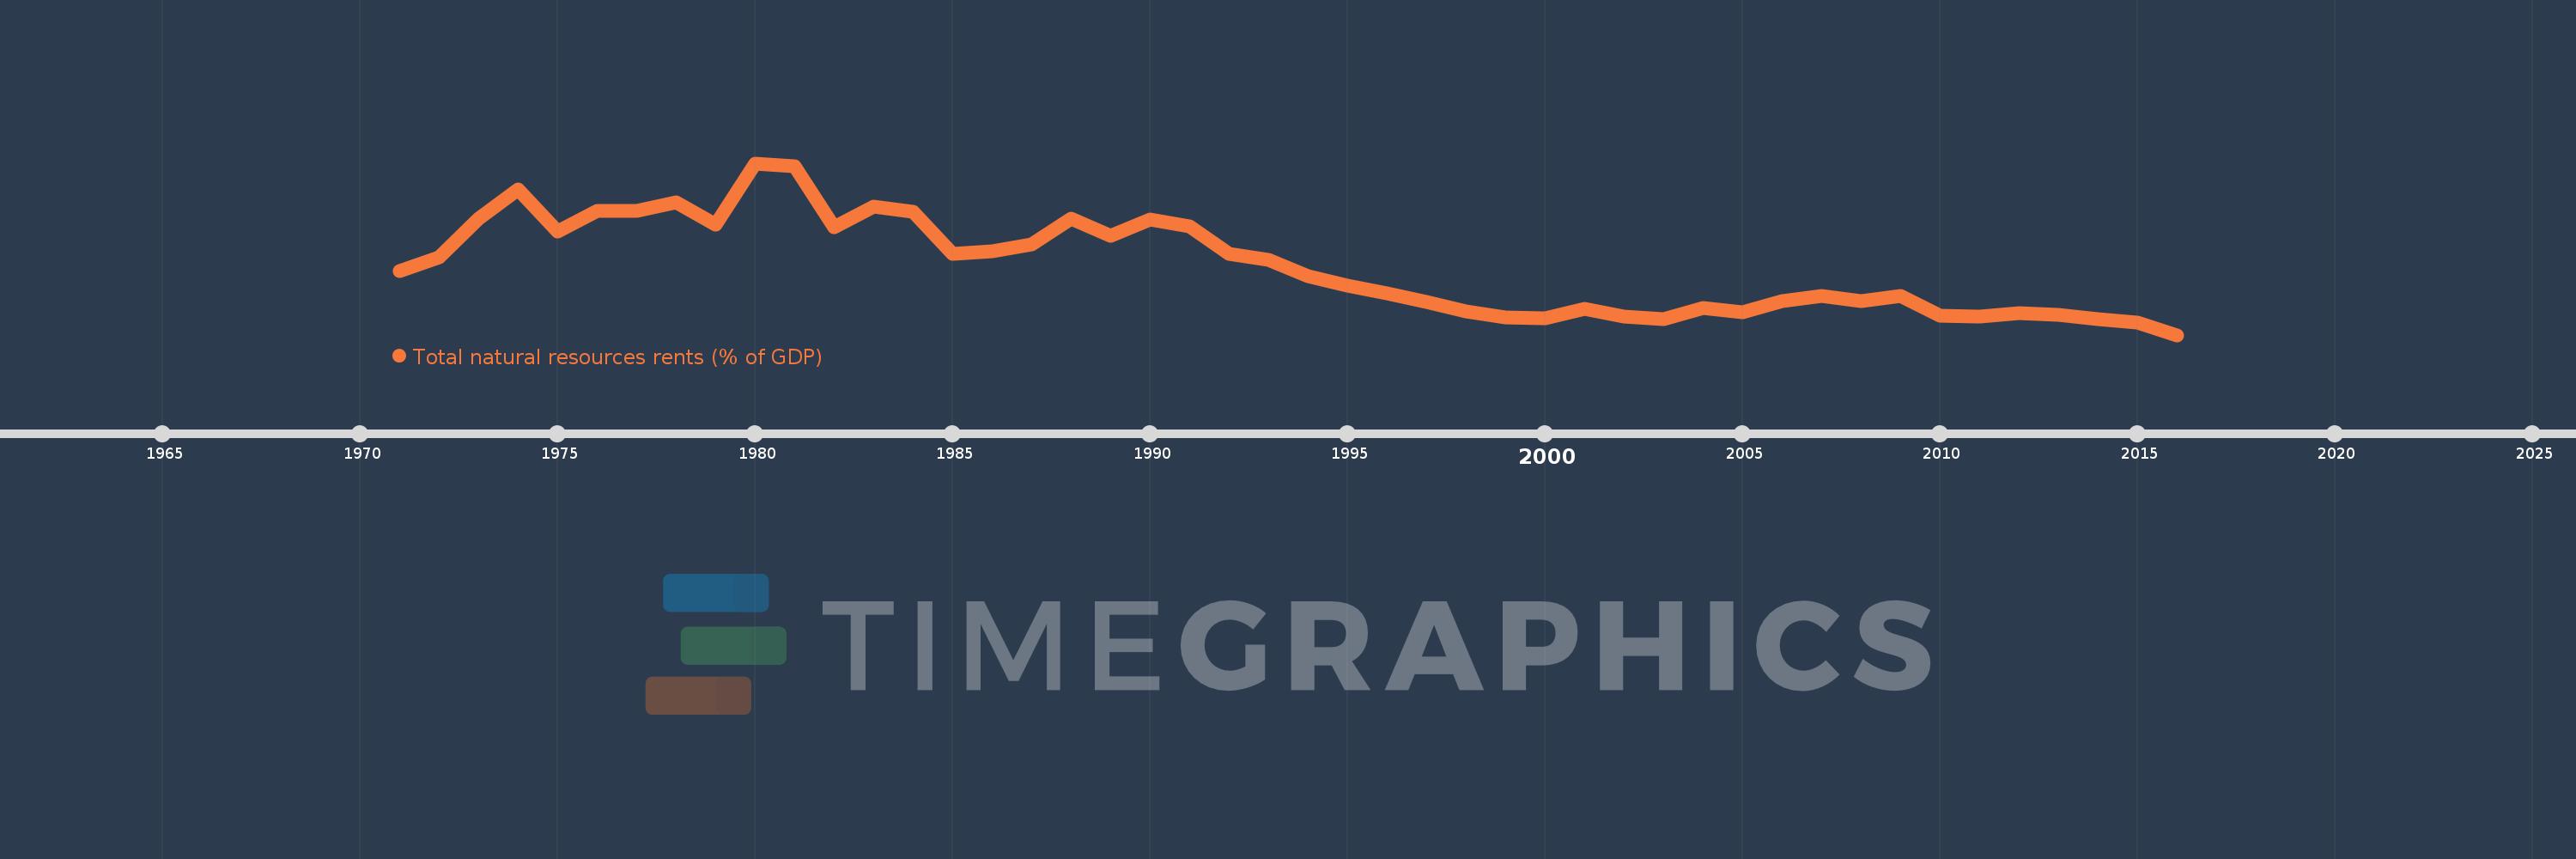
Total natural resources rents (% of GDP)
2016,2015,2014,2013,2012,2011,2010,2009,2008,2007,2006,2005,2004,2003,2002,2001,2000,1999,1998,1997,1996,1995,1994,1993,1992,1991,1990,1989,1988,1987,1986,1985,1984,1983,1982,1981,1980,1979,1978,1977,1976,1975,1974,1973,1972,1971
Estas estadísticas en otros países:
AfghanistanAlbaniaAlgeriaAngolaArab WorldArgentinaArmeniaArubaAustraliaAustriaAzerbaijanBahamas, TheBahrainBangladeshBarbadosBelarusBelgiumBelizeBeninBhutanBoliviaBosnia and HerzegovinaBotswanaBrazilBrunei DarussalamBulgariaBurkina FasoBurundiCabo VerdeCambodiaCameroonCanadaCaribbean small statesCentral African RepublicCentral Europe and the BalticsChadChileChinaColombiaComorosCongo, Dem. Rep.Congo, Rep.Costa RicaCote d'IvoireCroatiaCubaCyprusCzech RepublicDenmarkDjiboutiDominicaDominican RepublicEarly-demographic dividendEast Asia & PacificEast Asia & Pacific (excluding high income)East Asia & Pacific (IDA & IBRD countries)EcuadorEgypt, Arab Rep.El SalvadorEquatorial GuineaEritreaEstoniaEthiopiaEuro areaEurope & Central AsiaEurope & Central Asia (excluding high income)Europe & Central Asia (IDA & IBRD countries)European UnionFijiFinlandFragile and conflict affected situationsFranceFrench PolynesiaGabonGambia, TheGeorgiaGermanyGhanaGreeceGuatemalaGuineaGuinea-BissauGuyanaHaitiHeavily indebted poor countries (HIPC)High incomeHondurasHong Kong SAR, ChinaHungaryIBRD onlyIcelandIDA & IBRD totalIDA blendIDA onlyIDA totalIndiaIndonesiaIran, Islamic Rep.IraqIrelandIsraelItalyJamaicaJapanJordanKazakhstanKenyaKiribatiKorea, Rep.KuwaitKyrgyz RepublicLao PDRLate-demographic dividendLatin America & Caribbean Latin America & Caribbean (excluding high income)Latin America & the Caribbean (IDA & IBRD countries)LatviaLeast developed countries: UN classificationLebanonLesothoLiberiaLibyaLithuaniaLow & middle incomeLow incomeLower middle incomeLuxembourgMacao SAR, ChinaMacedonia, FYRMadagascarMalawiMalaysiaMaldivesMaliMaltaMauritaniaMauritiusMexicoMiddle East & North AfricaMiddle East & North Africa (excluding high income)Middle East & North Africa (IDA & IBRD countries)Middle incomeMoldovaMongoliaMontenegroMoroccoMozambiqueMyanmarNamibiaNepalNetherlandsNew CaledoniaNew ZealandNicaraguaNigerNigeriaNorth AmericaNorwayOECD membersOmanOther small statesPacific island small statesPakistanPanamaPapua New GuineaParaguayPeruPhilippinesPolandPortugalPost-demographic dividendPre-demographic dividendQatarRomaniaRussian FederationRwandaSamoaSao Tome and PrincipeSaudi ArabiaSenegalSerbiaSeychellesSierra LeoneSingaporeSlovak RepublicSloveniaSmall statesSolomon IslandsSouth AfricaSouth AsiaSouth Asia (IDA & IBRD)South SudanSpainSri LankaSt. LuciaSt. Vincent and the GrenadinesSub-Saharan Africa Sub-Saharan Africa (excluding high income)Sub-Saharan Africa (IDA & IBRD countries)SudanSurinameSwazilandSwedenSwitzerlandSyrian Arab RepublicTajikistanTanzaniaThailandTimor-LesteTogoTongaTrinidad and TobagoTunisiaTurkeyTurkmenistanUgandaUkraineUnited Arab EmiratesUnited KingdomUnited StatesUpper middle incomeUruguayUzbekistanVanuatuVenezuela, RBVietnamWorldYemen, Rep.ZambiaZimbabwe línea de tiempo (timeline):
En esta escala de tiempo se presenta un gráfico de 1971 y 2016 de Malaysia. Los datos de 1970 están ausentes. El número de observaciones reales por fecha: 46.
Fuente (nombre):
Indicadores del desarrollo mundial
Fuente (organización):
Estimates based on sources and methods described in "The Changing Wealth of Nations: Measuring Sustainable Development in the New Millennium" (World Bank, 2011).
Categorías:
Energy & Mining, Environment
Se ha actualizado:
23 abr 2017 año
Los indicadores de los cambios de valor en los últimos años
Mínimo:
4.84
1 ene 2016 año
Máximo:
37.646
1 ene 1980 año
A la fecha de observación
Valor
Cambio absoluto
El cambio con respecto al valor anterior
1 ene 1971 año
16.988
+16.988
0.0%
1 ene 1972 año
19.717
+2.729
16.07%
1 ene 1973 año
27.084
+7.367
37.36%
1 ene 1974 año
32.575
+5.491
20.27%
1 ene 1975 año
24.637
-7.938
-24.37%
1 ene 1976 año
28.48
+3.842
15.59%
1 ene 1977 año
28.506
+0.027
0.09%
1 ene 1978 año
30.152
+1.645
5.77%
1 ene 1979 año
25.892
-4.26
-14.13%
1 ene 1980 año
37.646
+11.754
45.4%
1 ene 1981 año
37.04
-0.606
-1.61%
1 ene 1982 año
25.403
-11.637
-31.42%
1 ene 1983 año
29.442
+4.04
15.9%
1 ene 1984 año
28.3
-1.142
-3.88%
1 ene 1985 año
20.285
-8.015
-28.32%
1 ene 1986 año
20.796
+0.511
2.52%
1 ene 1987 año
22.182
+1.385
6.66%
1 ene 1988 año
27.056
+4.874
21.97%
1 ene 1989 año
23.818
-3.238
-11.97%
1 ene 1990 año
26.895
+3.078
12.92%
1 ene 1991 año
25.653
-1.242
-4.62%
1 ene 1992 año
20.392
-5.261
-20.51%
1 ene 1993 año
19.194
-1.199
-5.88%
1 ene 1994 año
16.153
-3.04
-15.84%
1 ene 1995 año
14.22
-1.933
-11.97%
1 ene 1996 año
12.834
-1.386
-9.75%
1 ene 1997 año
11.211
-1.623
-12.65%
1 ene 1998 año
9.335
-1.876
-16.73%
1 ene 1999 año
8.259
-1.077
-11.53%
1 ene 2000 año
8.082
-0.176
-2.14%
1 ene 2001 año
9.795
+1.713
21.2%
1 ene 2002 año
8.287
-1.508
-15.4%
1 ene 2003 año
7.954
-0.333
-4.02%
1 ene 2004 año
9.945
+1.991
25.03%
1 ene 2005 año
9.166
-0.779
-7.83%
1 ene 2006 año
11.279
+2.113
23.05%
1 ene 2007 año
12.246
+0.967
8.57%
1 ene 2008 año
11.393
-0.853
-6.96%
1 ene 2009 año
12.286
+0.893
7.83%
1 ene 2010 año
8.481
-3.805
-30.97%
1 ene 2011 año
8.382
-0.099
-1.17%
1 ene 2012 año
9.063
+0.681
8.13%
1 ene 2013 año
8.667
-0.397
-4.38%
1 ene 2014 año
7.83
-0.837
-9.66%
1 ene 2015 año
7.234
-0.595
-7.6%
1 ene 2016 año
4.84
-2.394
-33.09%
Ranking de los países por los datos estadísticos actuales


Comentarios: