29
/es/
es
AIzaSyAYiBZKx7MnpbEhh9jyipgxe19OcubqV5w
April 1, 2024
256405
Sweden
SWE
true
2
1
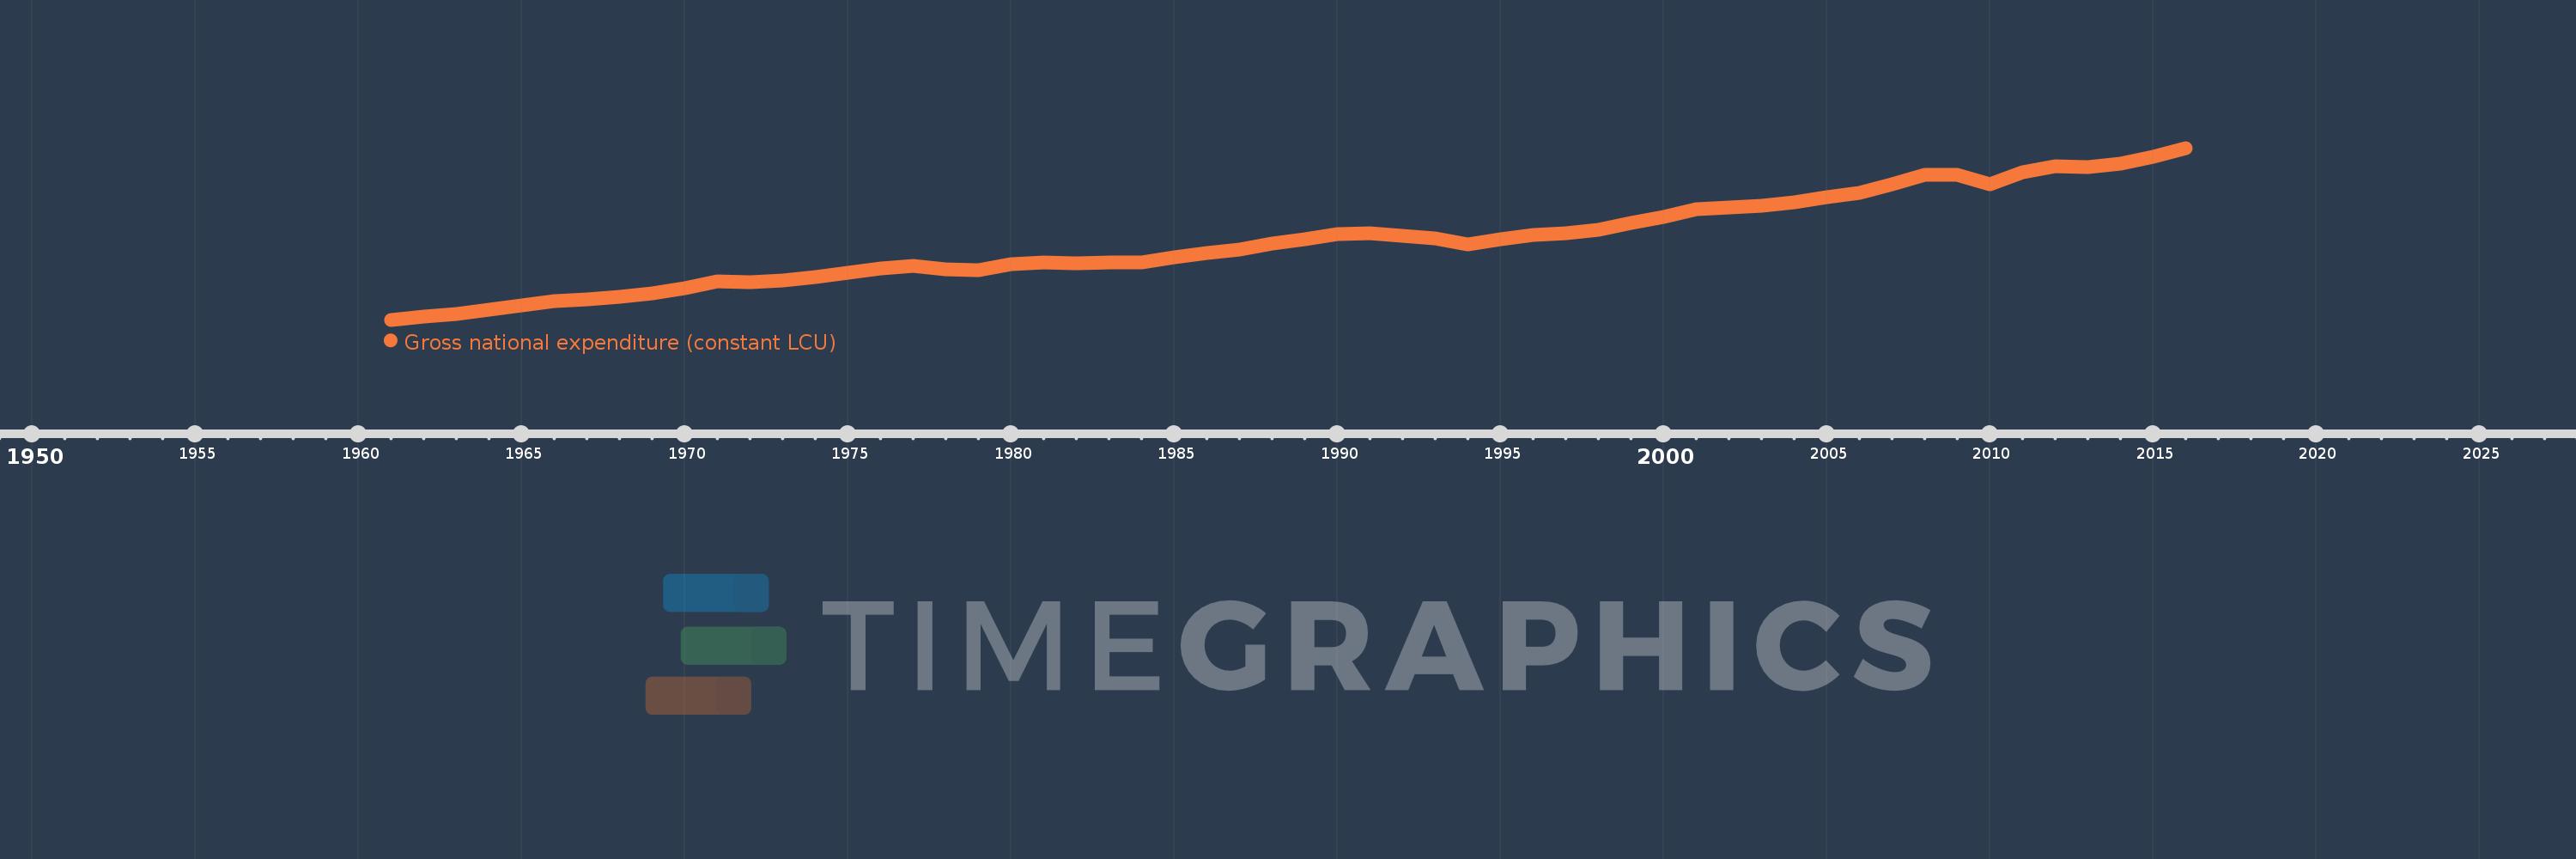
Gross national expenditure (constant LCU)
2016,2015,2014,2013,2012,2011,2010,2009,2008,2007,2006,2005,2004,2003,2002,2001,2000,1999,1998,1997,1996,1995,1994,1993,1992,1991,1990,1989,1988,1987,1986,1985,1984,1983,1982,1981,1980,1979,1978,1977,1976,1975,1974,1973,1972,1971,1970,1969,1968,1967,1966,1965,1964,1963,1962,1961
Estas estadísticas en otros países:
AlbaniaAlgeriaAngolaAntigua and BarbudaArgentinaArmeniaAustraliaAustriaAzerbaijanBahamas, TheBahrainBangladeshBarbadosBelarusBelgiumBelizeBeninBhutanBoliviaBosnia and HerzegovinaBotswanaBrazilBrunei DarussalamBulgariaBurkina FasoBurundiCabo VerdeCambodiaCameroonCanadaChadChileChinaColombiaComorosCongo, Dem. Rep.Congo, Rep.Costa RicaCote d'IvoireCroatiaCubaCyprusCzech RepublicDenmarkDjiboutiDominican RepublicEcuadorEgypt, Arab Rep.El SalvadorEquatorial GuineaEritreaEstoniaEthiopiaFijiFinlandFranceGabonGambia, TheGeorgiaGermanyGhanaGreeceGuatemalaGuineaGuinea-BissauHaitiHondurasHong Kong SAR, ChinaHungaryIcelandIndiaIndonesiaIran, Islamic Rep.IrelandIsraelItalyJamaicaJapanJordanKazakhstanKenyaKorea, Rep.KosovoKuwaitKyrgyz RepublicLao PDRLatviaLebanonLiberiaLibyaLithuaniaLuxembourgMacao SAR, ChinaMacedonia, FYRMadagascarMalawiMalaysiaMaliMaltaMauritaniaMauritiusMexicoMoldovaMongoliaMontenegroMoroccoMozambiqueMyanmarNamibiaNepalNetherlandsNew ZealandNicaraguaNigerNigeriaNorwayOmanPakistanPanamaPapua New GuineaParaguayPeruPhilippinesPolandPortugalPuerto RicoQatarRomaniaRussian FederationRwandaSamoaSaudi ArabiaSenegalSerbiaSeychellesSierra LeoneSingaporeSlovak RepublicSloveniaSomaliaSouth AfricaSouth SudanSpainSri LankaSudanSurinameSwazilandSwedenSwitzerlandSyrian Arab RepublicTajikistanTanzaniaThailandTimor-LesteTogoTrinidad and TobagoTunisiaTurkeyTurkmenistanUgandaUkraineUnited Arab EmiratesUnited KingdomUnited StatesUruguayUzbekistanVanuatuVenezuela, RBVietnamWest Bank and GazaZambiaZimbabwe línea de tiempo (timeline):
En esta escala de tiempo se presenta un gráfico de 1961 y 2016 de Sweden. Los datos de 1960 están ausentes. El número de observaciones reales por fecha: 56.
Fuente (nombre):
Indicadores del desarrollo mundial
Fuente (organización):
World Bank national accounts data, and OECD National Accounts data files.
Categorías:
Economy & Growth
Se ha actualizado:
23 abr 2017 año
Los indicadores de los cambios de valor en los últimos años
En promedio:
2.241 billones
Mínimo:
1.022 billones
1 ene 1961 año
Máximo:
3.707 billones
1 ene 2016 año
A la fecha de observación
Valor
Cambio absoluto
El cambio con respecto al valor anterior
1 ene 1961 año
1.022 billones
+1.022 billones
0.0%
1 ene 1962 año
1.072 billones
+49.592 bn
4.85%
1 ene 1963 año
1.115 billones
+43.097 bn
4.02%
1 ene 1964 año
1.175 billones
+59.855 bn
5.37%
1 ene 1965 año
1.253 billones
+77.775 bn
6.62%
1 ene 1966 año
1.318 billones
+65.53 bn
5.23%
1 ene 1967 año
1.346 billones
+27.76 bn
2.11%
1 ene 1968 año
1.385 billones
+39.154 bn
2.91%
1 ene 1969 año
1.439 billones
+54.294 bn
3.92%
1 ene 1970 año
1.519 billones
+79.966 bn
5.56%
1 ene 1971 año
1.618 billones
+98.2 bn
6.46%
1 ene 1972 año
1.609 billones
-8.545 bn
-0.53%
1 ene 1973 año
1.642 billones
+32.887 bn
2.04%
1 ene 1974 año
1.69 billones
+48.064 bn
2.93%
1 ene 1975 año
1.762 billones
+71.609 bn
4.24%
1 ene 1976 año
1.822 billones
+60.57 bn
3.44%
1 ene 1977 año
1.862 billones
+39.735 bn
2.18%
1 ene 1978 año
1.814 billones
-48.293 bn
-2.59%
1 ene 1979 año
1.797 billones
-16.444 bn
-0.91%
1 ene 1980 año
1.888 billones
+90.518 bn
5.04%
1 ene 1981 año
1.923 billones
+34.915 bn
1.85%
1 ene 1982 año
1.9 billones
-22.707 bn
-1.18%
1 ene 1983 año
1.917 billones
+16.979 bn
0.89%
1 ene 1984 año
1.918 billones
+1.423 bn
0.07%
1 ene 1985 año
1.993 billones
+74.69 bn
3.89%
1 ene 1986 año
2.066 billones
+73.353 bn
3.68%
1 ene 1987 año
2.124 billones
+57.325 bn
2.77%
1 ene 1988 año
2.212 billones
+87.797 bn
4.13%
1 ene 1989 año
2.277 billones
+65.714 bn
2.97%
1 ene 1990 año
2.363 billones
+86.091 bn
3.78%
1 ene 1991 año
2.375 billones
+11.809 bn
0.5%
1 ene 1992 año
2.329 billones
-46.04 bn
-1.94%
1 ene 1993 año
2.3 billones
-29.535 bn
-1.27%
1 ene 1994 año
2.194 billones
-105.532 bn
-4.59%
1 ene 1995 año
2.278 billones
+84.114 bn
3.83%
1 ene 1996 año
2.342 billones
+63.792 bn
2.8%
1 ene 1997 año
2.371 billones
+29.296 bn
1.25%
1 ene 1998 año
2.423 billones
+51.519 bn
2.17%
1 ene 1999 año
2.541 billones
+117.875 bn
4.87%
1 ene 2000 año
2.635 billones
+94.194 bn
3.71%
1 ene 2001 año
2.754 billones
+118.708 bn
4.51%
1 ene 2002 año
2.772 billones
+18.254 bn
0.66%
1 ene 2003 año
2.803 billones
+31.549 bn
1.14%
1 ene 2004 año
2.864 billones
+60.526 bn
2.16%
1 ene 2005 año
2.932 billones
+68.562 bn
2.39%
1 ene 2006 año
3.01 billones
+77.959 bn
2.66%
1 ene 2007 año
3.136 billones
+126.111 bn
4.19%
1 ene 2008 año
3.282 billones
+145.679 bn
4.64%
1 ene 2009 año
3.284 billones
+1.339 bn
0.04%
1 ene 2010 año
3.14 billones
-143.823 bn
-4.38%
1 ene 2011 año
3.328 billones
+187.85 bn
5.98%
1 ene 2012 año
3.427 billones
+99.845 bn
3.0%
1 ene 2013 año
3.408 billones
-19.858 bn
-0.58%
1 ene 2014 año
3.464 billones
+56.357 bn
1.65%
1 ene 2015 año
3.565 billones
+101.127 bn
2.92%
1 ene 2016 año
3.707 billones
+142.095 bn
3.99%
Ranking de los países por los datos estadísticos actuales


Comentarios: