29
/es/
es
AIzaSyAYiBZKx7MnpbEhh9jyipgxe19OcubqV5w
April 1, 2024
139337
Germany
DEU
true
2
1
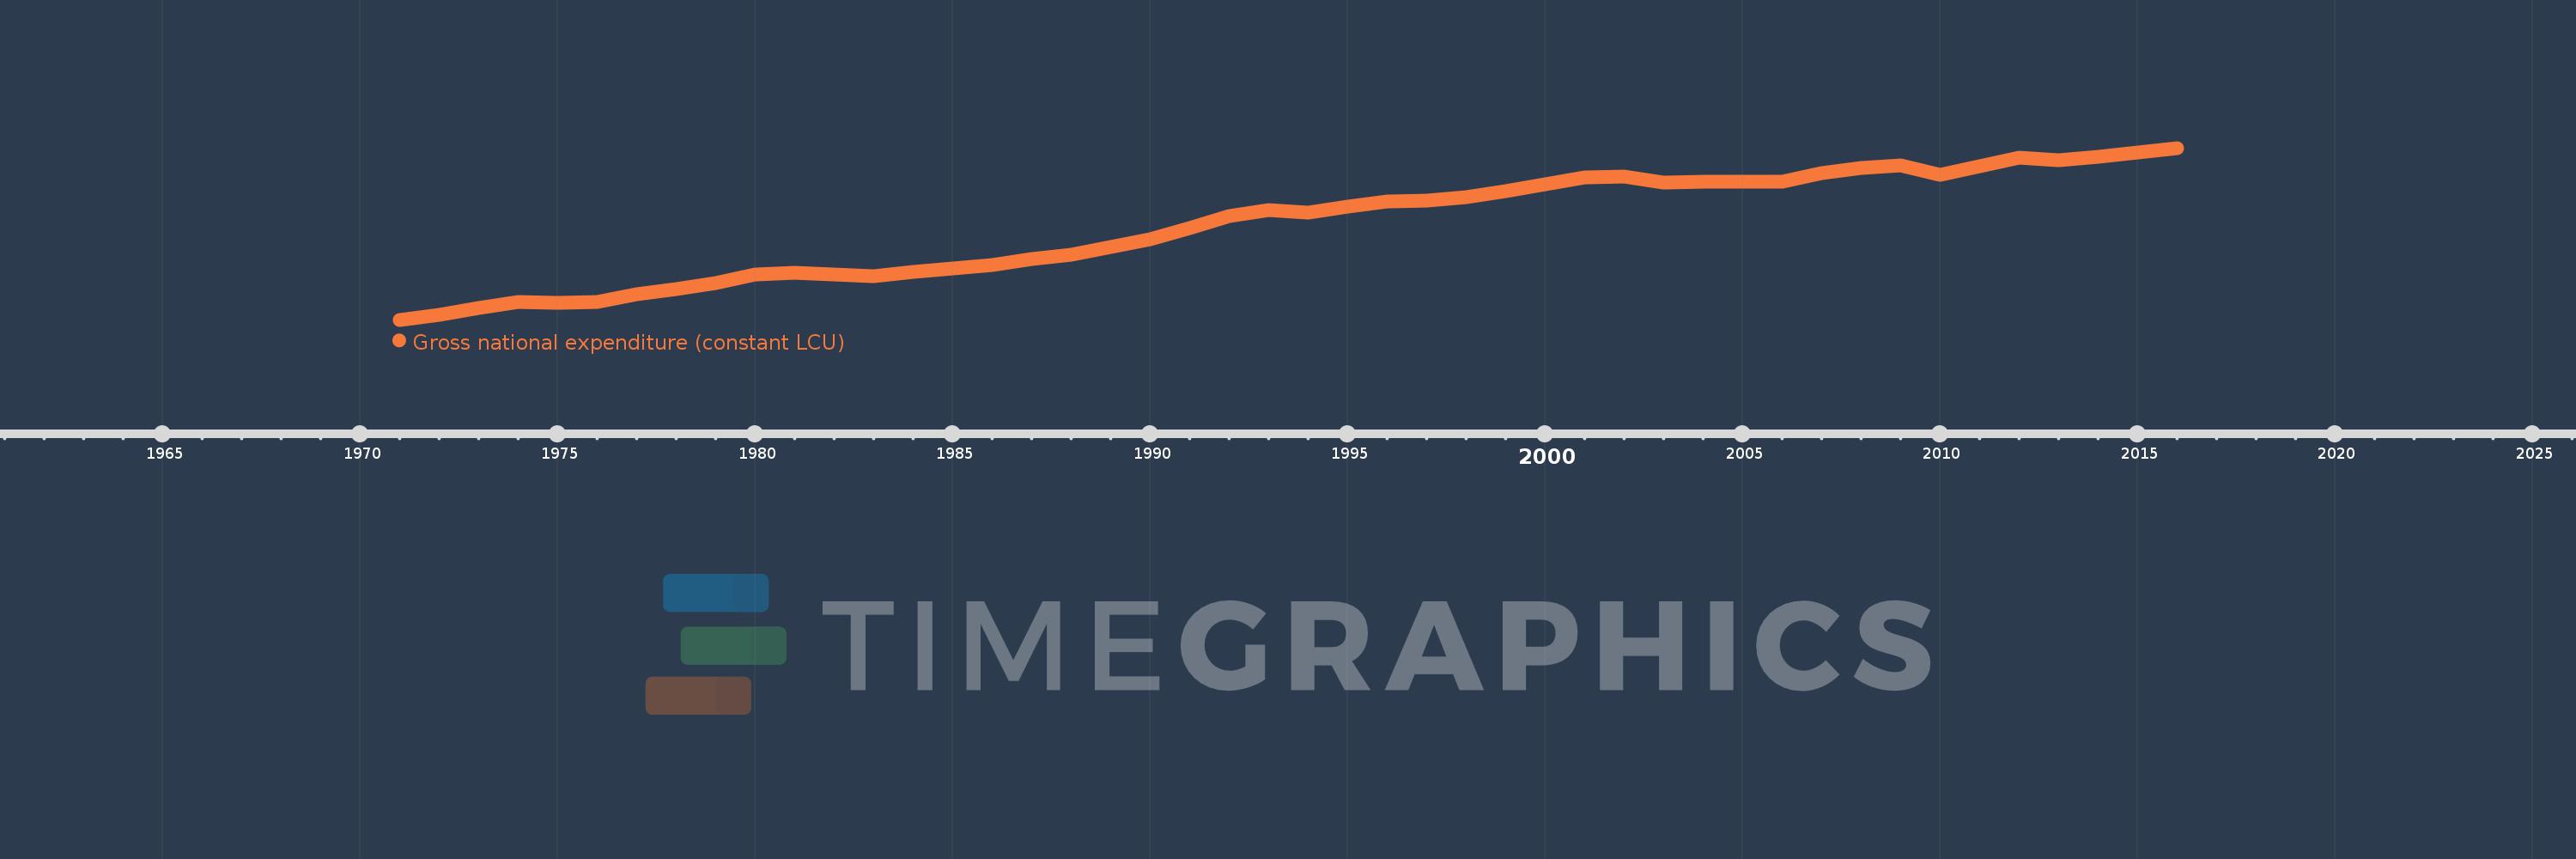
Gross national expenditure (constant LCU)
2016,2015,2014,2013,2012,2011,2010,2009,2008,2007,2006,2005,2004,2003,2002,2001,2000,1999,1998,1997,1996,1995,1994,1993,1992,1991,1990,1989,1988,1987,1986,1985,1984,1983,1982,1981,1980,1979,1978,1977,1976,1975,1974,1973,1972,1971
Estas estadísticas en otros países:
AlbaniaAlgeriaAngolaAntigua and BarbudaArgentinaArmeniaAustraliaAustriaAzerbaijanBahamas, TheBahrainBangladeshBarbadosBelarusBelgiumBelizeBeninBhutanBoliviaBosnia and HerzegovinaBotswanaBrazilBrunei DarussalamBulgariaBurkina FasoBurundiCabo VerdeCambodiaCameroonCanadaChadChileChinaColombiaComorosCongo, Dem. Rep.Congo, Rep.Costa RicaCote d'IvoireCroatiaCubaCyprusCzech RepublicDenmarkDjiboutiDominican RepublicEcuadorEgypt, Arab Rep.El SalvadorEquatorial GuineaEritreaEstoniaEthiopiaFijiFinlandFranceGabonGambia, TheGeorgiaGermanyGhanaGreeceGuatemalaGuineaGuinea-BissauHaitiHondurasHong Kong SAR, ChinaHungaryIcelandIndiaIndonesiaIran, Islamic Rep.IrelandIsraelItalyJamaicaJapanJordanKazakhstanKenyaKorea, Rep.KosovoKuwaitKyrgyz RepublicLao PDRLatviaLebanonLiberiaLibyaLithuaniaLuxembourgMacao SAR, ChinaMacedonia, FYRMadagascarMalawiMalaysiaMaliMaltaMauritaniaMauritiusMexicoMoldovaMongoliaMontenegroMoroccoMozambiqueMyanmarNamibiaNepalNetherlandsNew ZealandNicaraguaNigerNigeriaNorwayOmanPakistanPanamaPapua New GuineaParaguayPeruPhilippinesPolandPortugalPuerto RicoQatarRomaniaRussian FederationRwandaSamoaSaudi ArabiaSenegalSerbiaSeychellesSierra LeoneSingaporeSlovak RepublicSloveniaSomaliaSouth AfricaSouth SudanSpainSri LankaSudanSurinameSwazilandSwedenSwitzerlandSyrian Arab RepublicTajikistanTanzaniaThailandTimor-LesteTogoTrinidad and TobagoTunisiaTurkeyTurkmenistanUgandaUkraineUnited Arab EmiratesUnited KingdomUnited StatesUruguayUzbekistanVanuatuVenezuela, RBVietnamWest Bank and GazaZambiaZimbabwe línea de tiempo (timeline):
En esta escala de tiempo se presenta un gráfico de 1971 y 2016 de Germany. Los datos de 1970 están ausentes. El número de observaciones reales por fecha: 46.
Fuente (nombre):
Indicadores del desarrollo mundial
Fuente (organización):
World Bank national accounts data, and OECD National Accounts data files.
Categorías:
Economy & Growth
Se ha actualizado:
23 abr 2017 año
Los indicadores de los cambios de valor en los últimos años
En promedio:
1.952 billones
Mínimo:
1.169 billones
1 ene 1971 año
Máximo:
2.595 billones
1 ene 2016 año
A la fecha de observación
Valor
Cambio absoluto
El cambio con respecto al valor anterior
1 ene 1971 año
1.169 billones
+1.169 billones
0.0%
1 ene 1972 año
1.212 billones
+43.635 bn
3.73%
1 ene 1973 año
1.265 billones
+52.906 bn
4.36%
1 ene 1974 año
1.315 billones
+50.114 bn
3.96%
1 ene 1975 año
1.309 billones
-6.291 bn
-0.48%
1 ene 1976 año
1.313 billones
+4.368 bn
0.33%
1 ene 1977 año
1.38 billones
+66.429 bn
5.06%
1 ene 1978 año
1.425 billones
+45.591 bn
3.3%
1 ene 1979 año
1.473 billones
+48.213 bn
3.38%
1 ene 1980 año
1.545 billones
+71.078 bn
4.82%
1 ene 1981 año
1.562 billones
+17.307 bn
1.12%
1 ene 1982 año
1.547 billones
-14.526 bn
-0.93%
1 ene 1983 año
1.531 billones
-16.518 bn
-1.07%
1 ene 1984 año
1.562 billones
+31.645 bn
2.07%
1 ene 1985 año
1.598 billones
+35.409 bn
2.27%
1 ene 1986 año
1.626 billones
+28.026 bn
1.75%
1 ene 1987 año
1.675 billones
+49.381 bn
3.04%
1 ene 1988 año
1.709 billones
+33.762 bn
2.02%
1 ene 1989 año
1.772 billones
+62.815 bn
3.68%
1 ene 1990 año
1.836 billones
+63.985 bn
3.61%
1 ene 1991 año
1.93 billones
+94.23 bn
5.13%
1 ene 1992 año
2.028 billones
+97.604 bn
5.06%
1 ene 1993 año
2.081 billones
+52.966 bn
2.61%
1 ene 1994 año
2.058 billones
-22.583 bn
-1.09%
1 ene 1995 año
2.11 billones
+52.002 bn
2.53%
1 ene 1996 año
2.149 billones
+38.8 bn
1.84%
1 ene 1997 año
2.159 billones
+9.736 bn
0.45%
1 ene 1998 año
2.184 billones
+25.041 bn
1.16%
1 ene 1999 año
2.234 billones
+50.494 bn
2.31%
1 ene 2000 año
2.297 billones
+62.879 bn
2.81%
1 ene 2001 año
2.348 billones
+51.322 bn
2.23%
1 ene 2002 año
2.356 billones
+7.601 bn
0.32%
1 ene 2003 año
2.309 billones
-46.598 bn
-1.98%
1 ene 2004 año
2.315 billones
+5.824 bn
0.25%
1 ene 2005 año
2.311 billones
-3.681 bn
-0.16%
1 ene 2006 año
2.315 billones
+4.002 bn
0.17%
1 ene 2007 año
2.383 billones
+67.198 bn
2.9%
1 ene 2008 año
2.426 billones
+43.101 bn
1.81%
1 ene 2009 año
2.453 billones
+27.638 bn
1.14%
1 ene 2010 año
2.374 billones
-79.148 bn
-3.23%
1 ene 2011 año
2.446 billones
+71.693 bn
3.02%
1 ene 2012 año
2.517 billones
+71.281 bn
2.91%
1 ene 2013 año
2.496 billones
-20.867 bn
-0.83%
1 ene 2014 año
2.519 billones
+22.728 bn
0.91%
1 ene 2015 año
2.554 billones
+35.253 bn
1.4%
1 ene 2016 año
2.595 billones
+40.865 bn
1.6%
Ranking de los países por los datos estadísticos actuales


Comentarios: